Gap Inc, one of the most reputed global apparel retailer , has released its financials for the First Quarter of 2018. In this report , we analysed in detail revenues & profits of their brands : Gap Global , Old Navy and Bananna Republic . The company came out with almost flat results with just 1% overall sales growth as compared to 2% growth last year. However, the senior executives at Gap were positive :
“We are pleased to have delivered our sixth consecutive quarter of positive comp growth, despite the expected challenges at Gap brand,” said Art Peck, president and Chief Executive Officer, Gap Inc.
“Our balanced growth strategy provides the right foundation to differentiate our portfolio of brands in this retail environment, with strategic investments in value, active and digital fueled by productivity opportunities unique to our scaled operating platform. Despite the pressures we faced in the first quarter, we are affirming our full-year guidance, reflecting our confidence in the underlying fundamentals of the business as well as the benefits of executing against our balanced growth strategy,” said Teri List-Stoll, executive vice president and Chief Financial Officer, Gap Inc.
- Old Navy Global: positive 3% versus positive 8% last year
- Gap Global: negative 4% versus negative 4% last year
- Banana Republic Global: positive 3% versus negative 4% last year .
1. Sales For First Quarter 2018
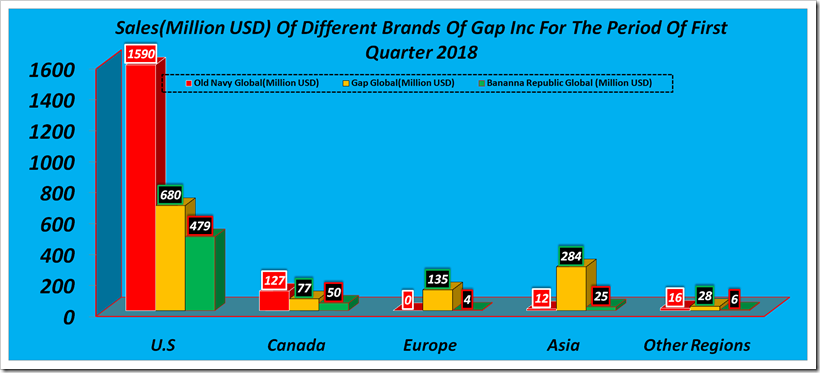
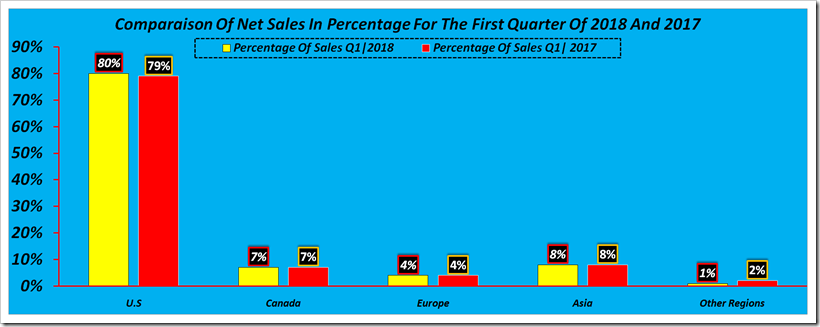
The table below shows the sales for the first quarter of 2018 . Old Navy Global tops the sales with USD 1,745 million turover followed by Gap Global where the sales was USD 1,204 million . Out Of the total revenue of USD 3,783 million , U.S.A continues to show the lions share of 80%, follwed by Canada which was 7% , Europe, Asia and Other Regions saw a share of 4%,8%, and 1% respectively.
Q1 2018 |
Old Navy Global(million USD) |
Gap Global(million USD) |
Bananna Republic Global(million USD) |
Others(million USD) |
Total(million USD) |
Percentage Of Sales |
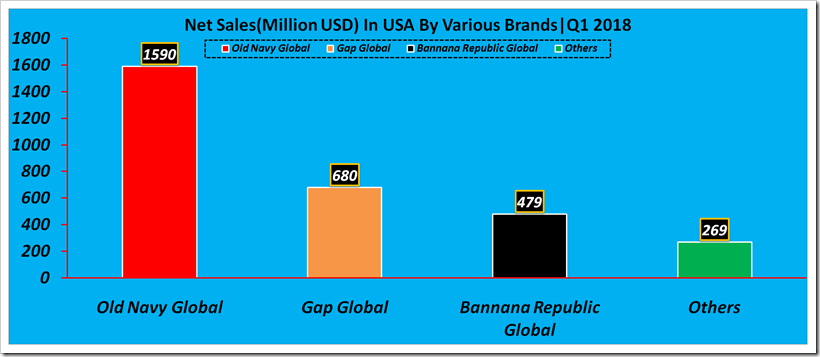
| U.S | 1,590 | 680 | 479 | 269 | 3,018 | 80% |
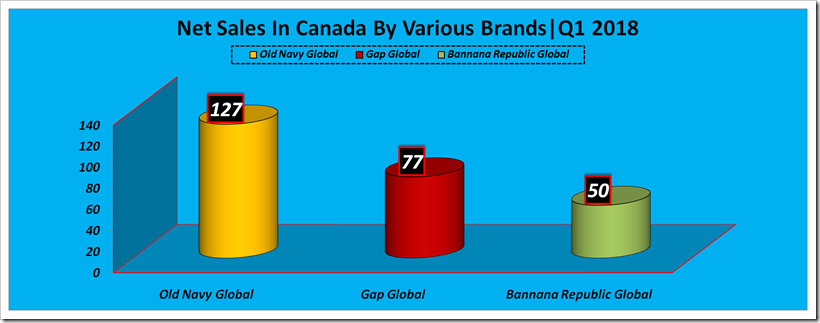
| Canada | 127 | 77 | 50 | 1 | 255 | 7% |
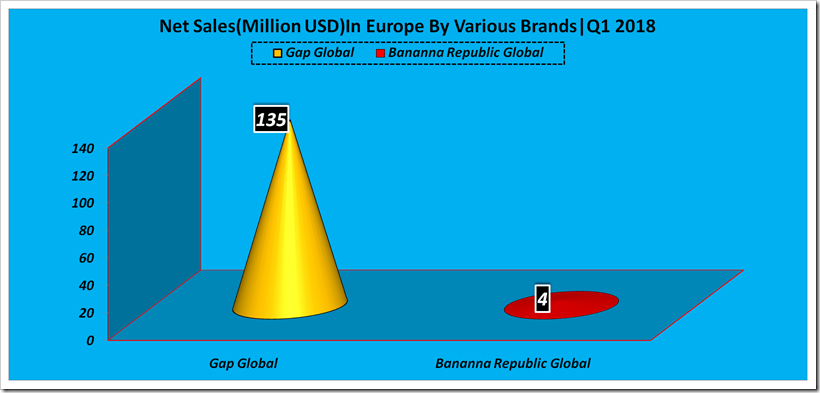
| Europe | 0 | 135 | 4 | 0 | 139 | 4% |
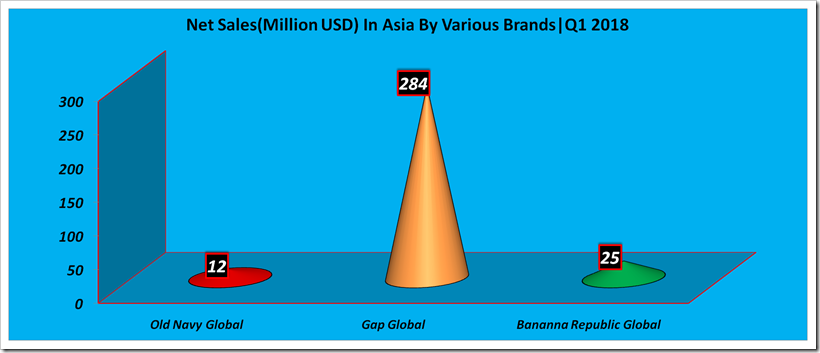
| Asia | 12 | 284 | 25 | 0 | 321 | 8% |
| Other Regions | 16 | 28 | 6 | 0 | 50 | 1% |
| Total | 1,745 | 1,204 | 564 | 270 | 3,783 | 100% |
2. Sales For The First Quarter Of 2018
Old Navy always takes the cake when it comes to share of all brands.
Q1 2017. |
Old Navy Global(million USD) |
Gap Global(million USD) |
Bananna Republic Global(million USD) |
Others(million USD) |
Total(million USD) |
Percentage Of Sales |
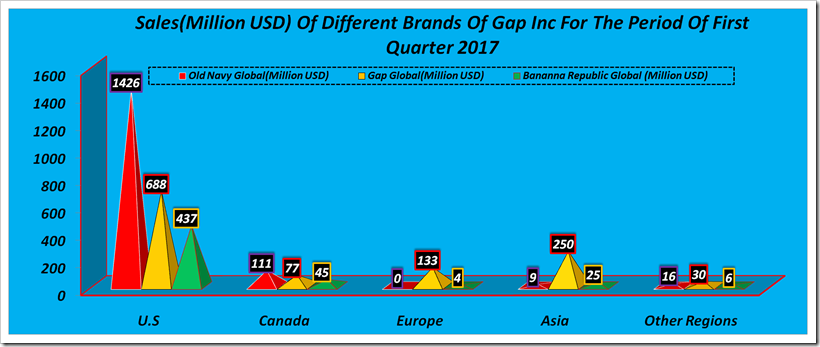
| U.S | 1,426 | 688 | 437 | 202 | 2,753 | 79% |
| Canada | 111 | 77 | 45 | 1 | 234 | 7% |
| Europe | 0 | 133 | 4 | 0 | 137 | 4% |
| Asia | 9 | 250 | 25 | 0 | 284 | 8% |
| Other Regions | 16 | 30 | 6 | 0 | 52 | 2% |
| Total | 1,562 | 1,178 | 517 | 203 | 3,460 | 100% |
Revenue Distribution By Brands In Different Regions For Q1|201
1. USA
2. Canada
3. Europe
4. Asia
% Of Net Sales | 2017 vs 2018
When we make a comparative analysis of Net Sales for the first quarter of 2017 and with the same period of 2018 we do not find any change in terms of percentage of sales, except in U.S.A where the increase in sales was just by 1%, and for other regions where the marginal decrease in sales was just 1%. The leading market was U.S.A followed by Asia, Canada and Europe. Conclusion – just managing to keep the same levels !
Particulars |
Percentage Of Sales Q1|2018 |
Percentage Of Sales Q1| 2017 |
| U.S | 80% | 79% |
| Canada | 7% | 7% |
| Europe | 4% | 4% |
| Asia | 8% | 8% |
| Other Regions | 1% | 2% |
| Total | 100% | 100% |
Comparative Analysis Of Revenue Distribution Of Different Brands For First Quarter Of 2018 And 2017
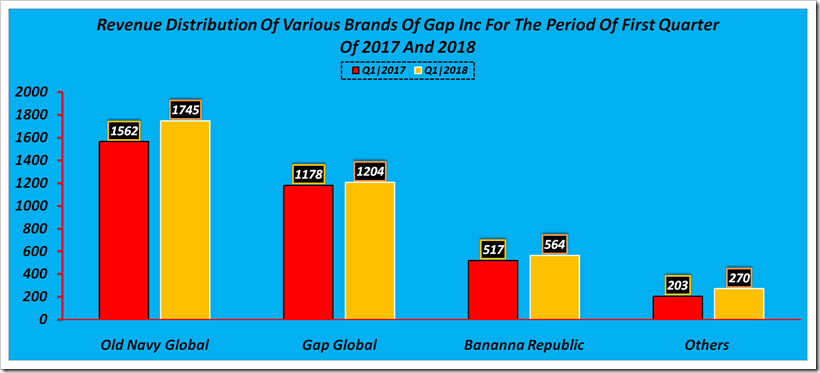
Gap Inc as a brand gained its shares in revenue from USD 3,783 million in first quarter of 2018, to USD 3,460 million in first quarter of 2017.The significant revenue generator was Old navy Global where the revenue increased from USD 1,562 million in first quarter of 2017 to USD 1745 million in same period of 2018. Similarly, Gap Global saw a marginal loss in revenue from 1,178 milion USD in first quarter of 2017 to 1,204 million usd in first quarter of 2018. Bananna Republic saw a increase in revenue from USD 517 million in first quarter of 2017 to USD 564 million in 2018.
Particulars |
Q1|2017(Million USD) |
Q1|2018(Million USD) |
| Old Navy Global | 1,562 | 1,745 |
| Gap Global0.
|
1,178 | 1,204 |
| Bananna Republic | 517 | 564 |
| Others | 203 | 270 |
| Total | 3,460 | 3,783 |


