Tag: US Denim Imports

  • Denim Apparel From Vietnam To USA – Top 15 Brands In 2023

    Denim Apparel From Vietnam To USA – Top 15 Brands In 2023

    This report outlines the critical dynamics between the USA’s leading retail brands and their Vietnamese garment suppliers throughout 2023. It focuses on the top 15 brands, their purchasing volumes, average price points, and supplier relationships. These insights provide a snapshot of the strategic sourcing and market positioning that underpin the denim apparel trade from Vietnam to the USA.

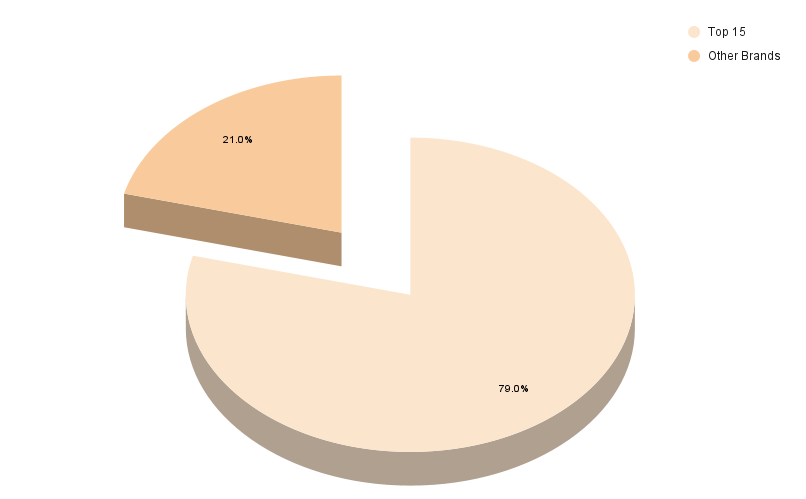
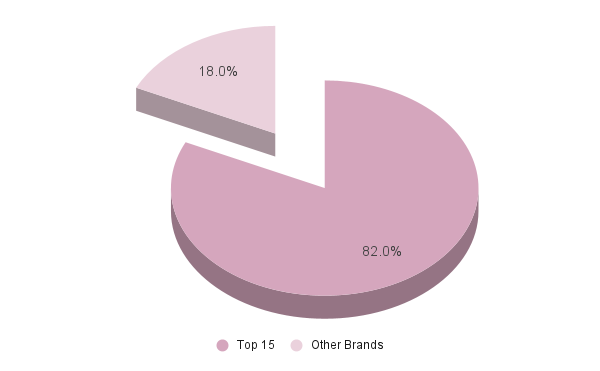
    Denim imports from Vietnam to the USA have remained robust in 2023, with the top 15 brands accounting for 79% of the market share. [private_special]

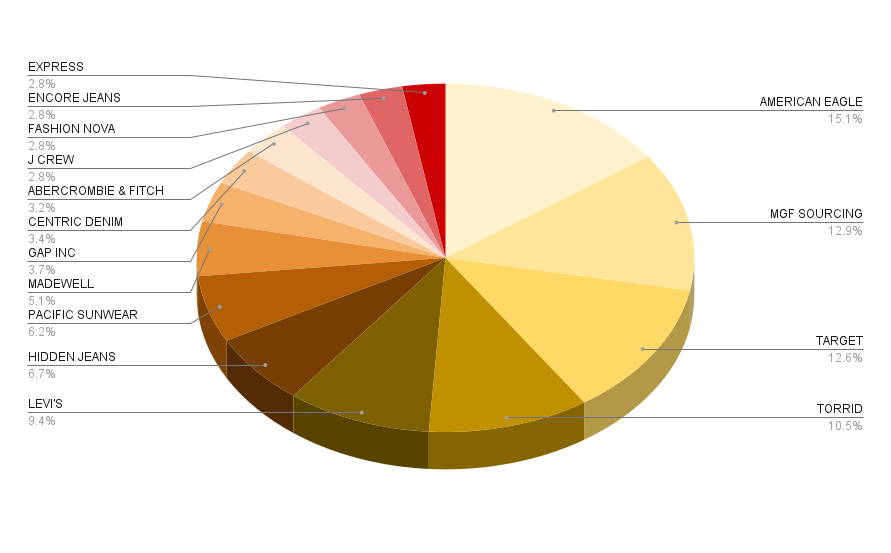
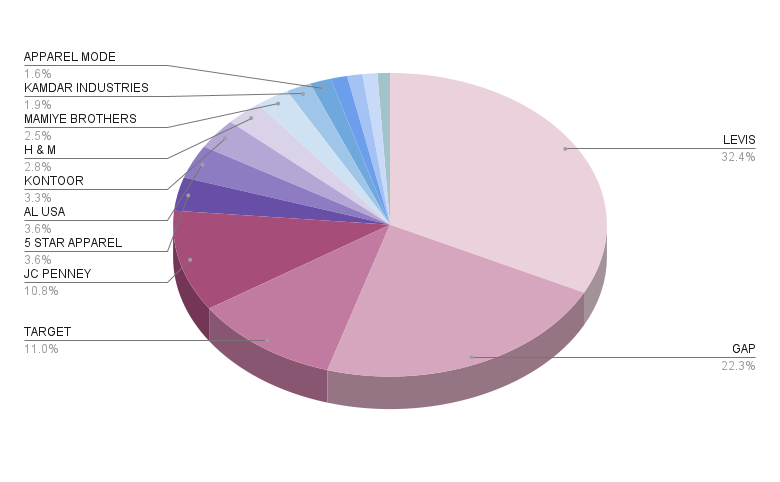
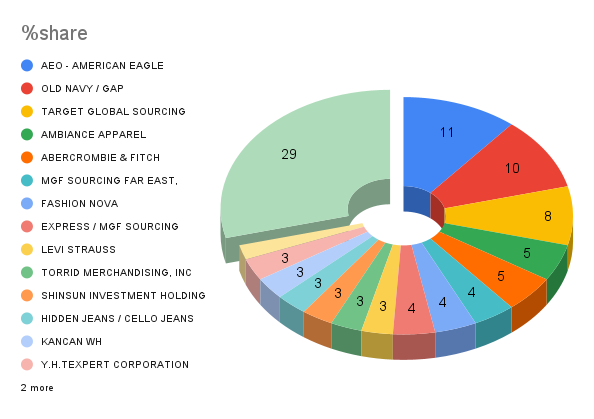
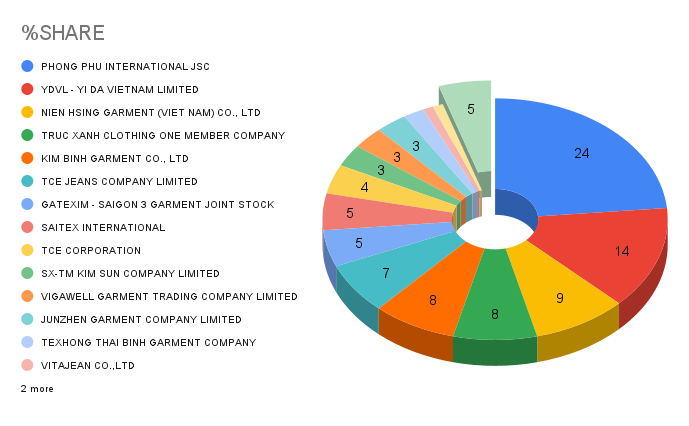
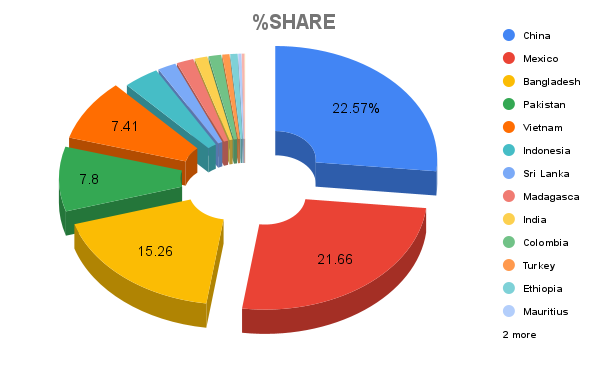
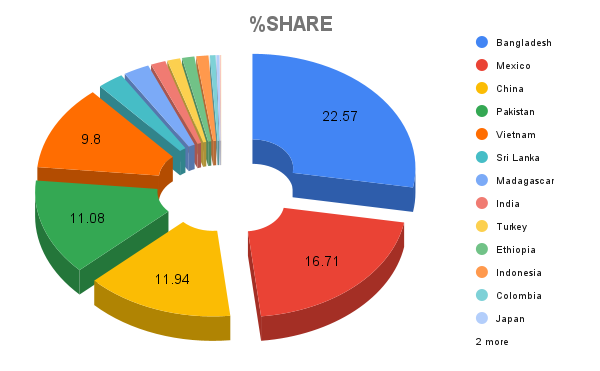
    Market Share Insights

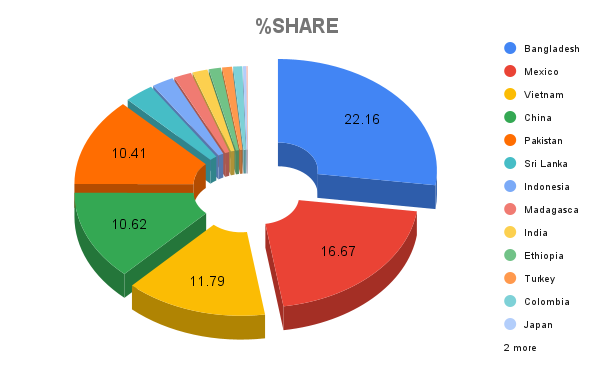
    The pie chart analysis indicates that American Eagle leads the market with 15.2% of the imports, closely followed by MGF Sourcing (which is sourcing on behalf of a number of brands ) and Target with 12.9% and 12.6% respectively. Torrid also claims a significant portion at 10.5%, asserting its strong market presence.

    Levi’s, a brand synonymous with denim, maintains a notable 9.4% share, emphasizing its enduring appeal. The rest of the market share is distributed among brands such as Hidden Jeans (6.7%), Pacific Sunwear (6.2%), and Madewell shipments to their own brands (5.4%), down to Encore Jeans which holds the smallest share among the top fifteen at 2.9%.

    Note: It is important to note that some buying houses like MGF buy in their own name and supply to other brands. Strictly speaking they are not final buyers.

    [private_special]Note: This report only reflects the shipments that were made to United States. If any shipments were made by these brands to other destinations, they would not be covered here.

    Purchasing Analysis of Top USA Companies Buying Denims From Vietnam

    Introduction

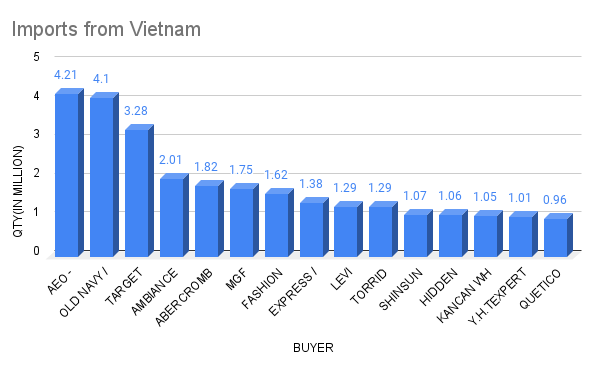
    The denim trade between Vietnam and the USA continues to thrive, with key players making significant purchases throughout 2023. The following is an analysis of the purchasing behaviors of these top USA brands, quantifying their transactions in terms of volume and value, and providing insight into their average expenditure on denim apparel.

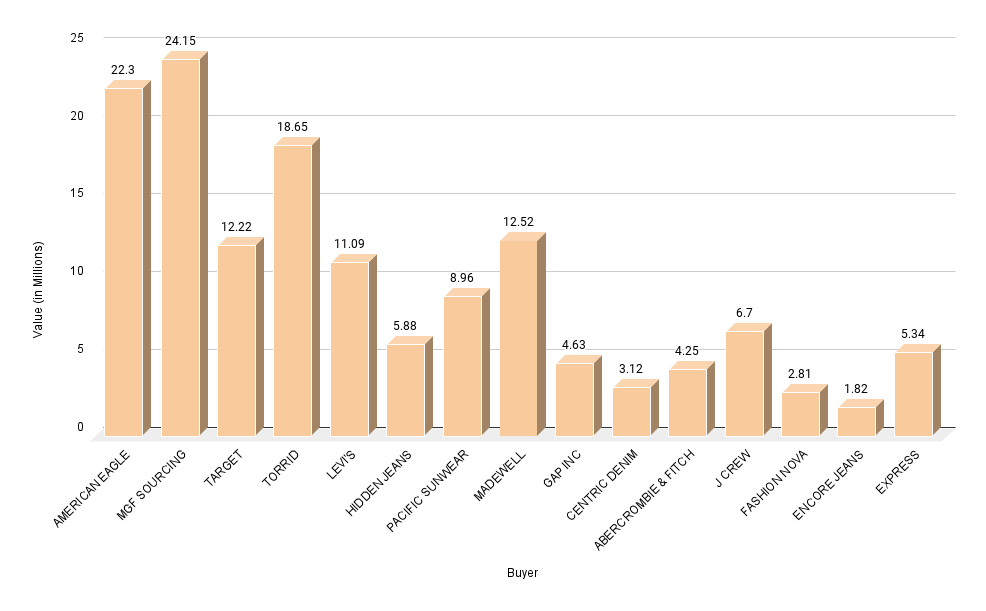
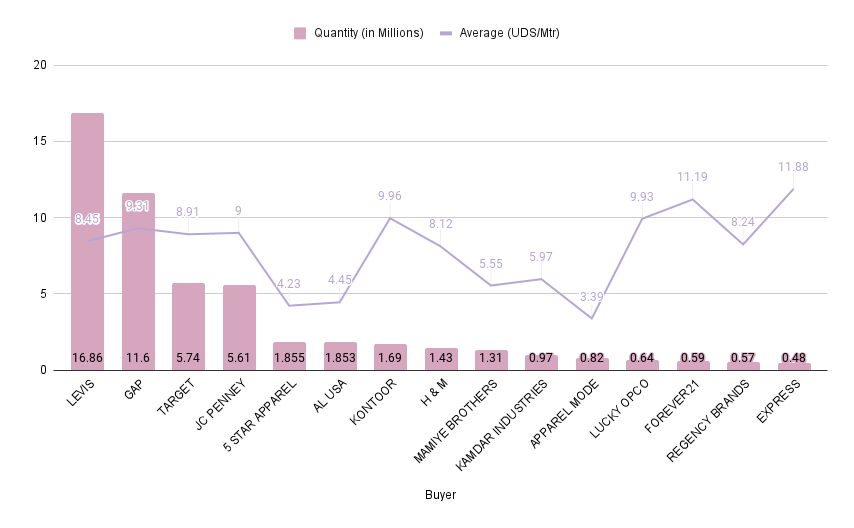
    Volume and Value Overview

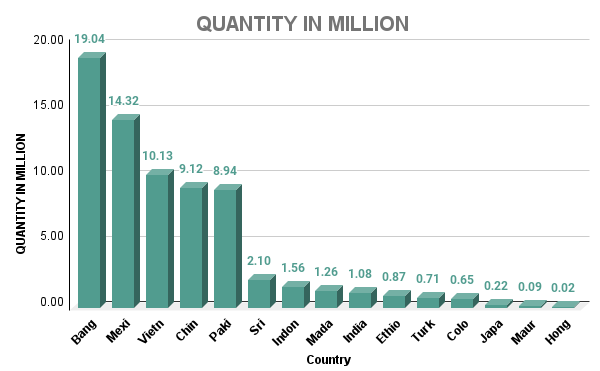
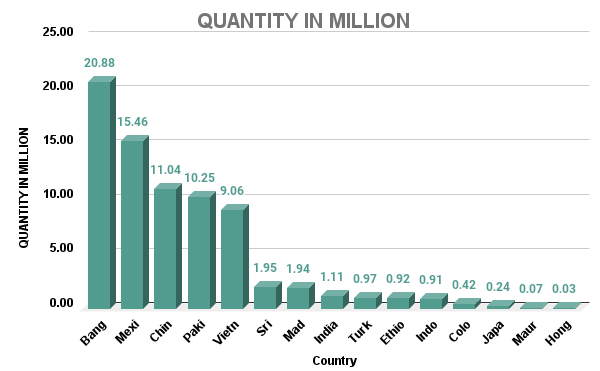
    • American Eagle: With the largest volume of denim imports, American Eagle has purchased 19.5 lakh pieces, amounting to a total import value of $22.3 million. This indicates American Eagle’s strong market presence and consumer demand fulfillment strategy.
    • MGF Sourcing: Following closely, MGF Sourcing has imported 16.6 lakh pieces with a higher total value at $24.15 million, suggesting a premium sourcing strategy or selection of higher-end denim products. It needs to be remembered that MGF works for various brands and therefore they are not final consumers. They normally work for AEO, Express, Target and other brands.
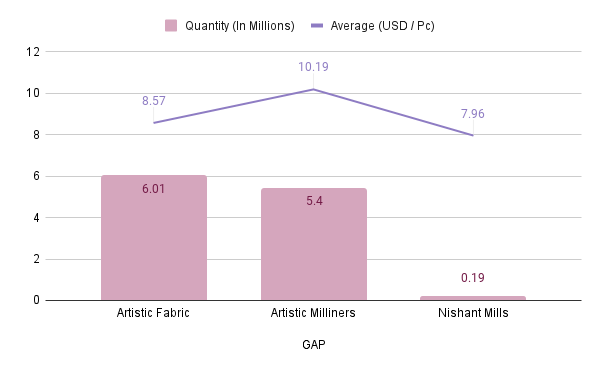
    • Target: Target procured 16.2 lakh pieces valued at $12.22 million, positioning itself as a value-focused retailer with a significant volume of denim imports.

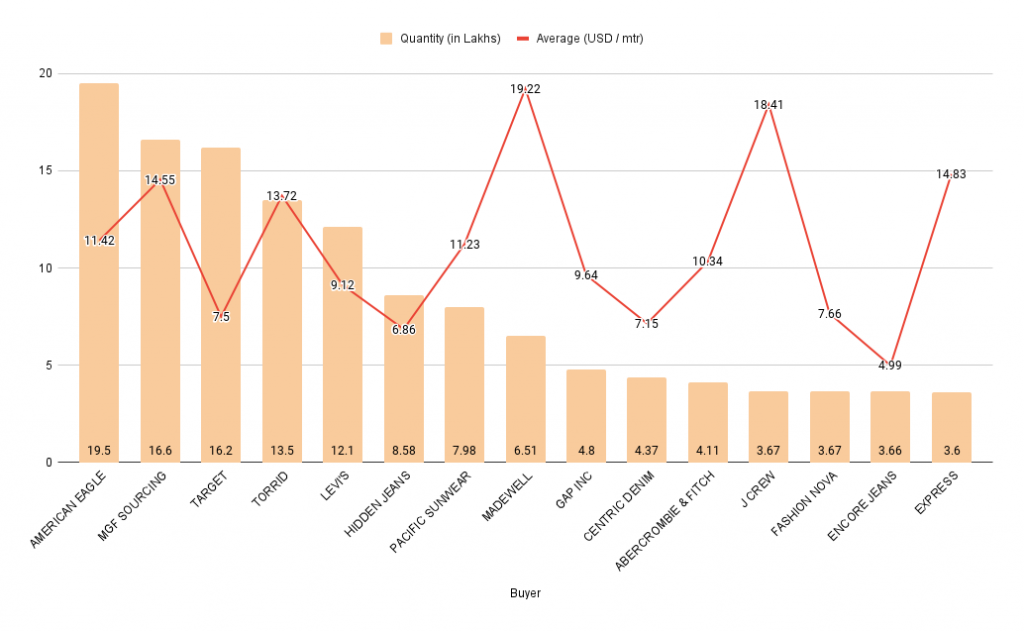
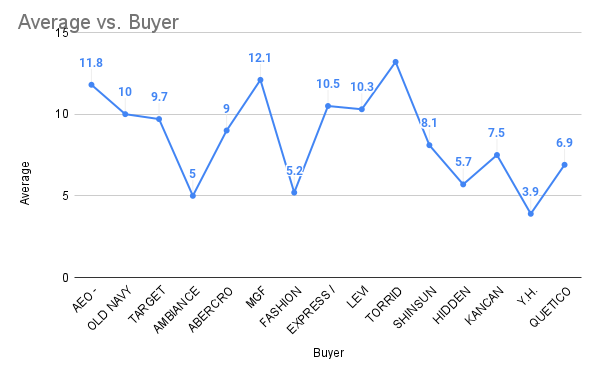
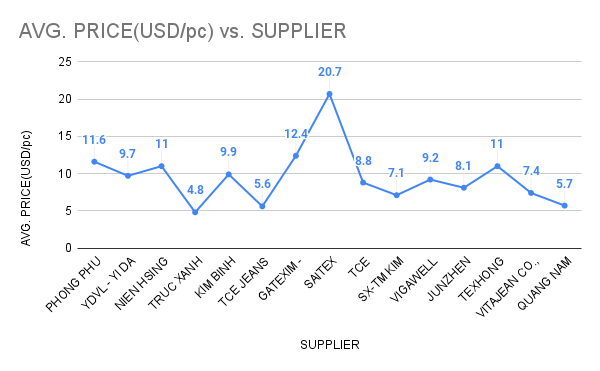
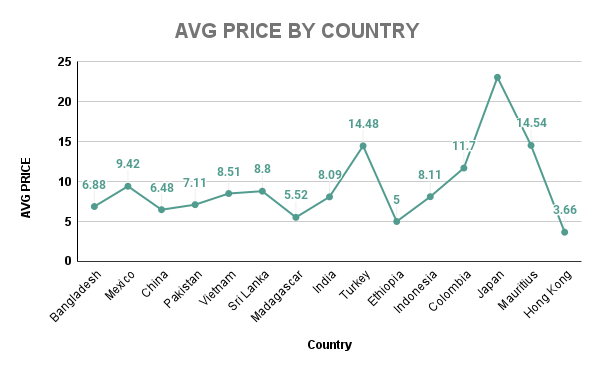
    Average Price Point Analysis

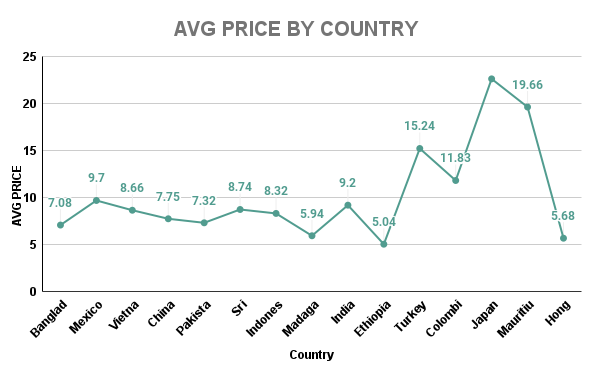
    • Madewell: Standing out in terms of the average price, Madewell’s purchases average at $19.22/piece indicating their positioning in the premium segment of the market.
    • J Crew: On the higher end, J Crew shows a substantial average price point of $18.41/piece reflecting their strategy to procure premium denim apparel.
    • Target: With one of the more cost-effective strategies, Target averages at $7.5/piece demonstrating their focus on value for their customer base.

    Key Insights

    The data reveals that while American Eagle leads in volume, MGF Sourcing leads in value, indicating different strategies among the top buyers. The average price points range significantly from $7.5 to $19.22 per garment, showcasing the diverse market positioning from value to premium segments among these brands.

    Analysis of Garment Suppliers for USA’s Top Retail Brands

    Introduction

    This section provides a detailed analysis of the relationships between USA’s top retail brands and their garment suppliers from Vietnam, focusing on the volume and average price points of the denim apparel procured in 2023.

    Note: YDVL is the Crystal Group , Gatexim is Saigon 3

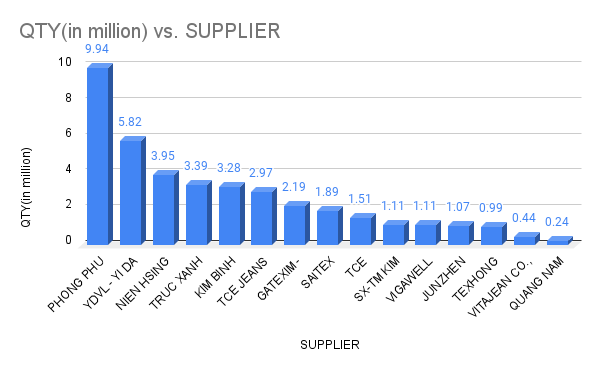
    Supplier Contributions

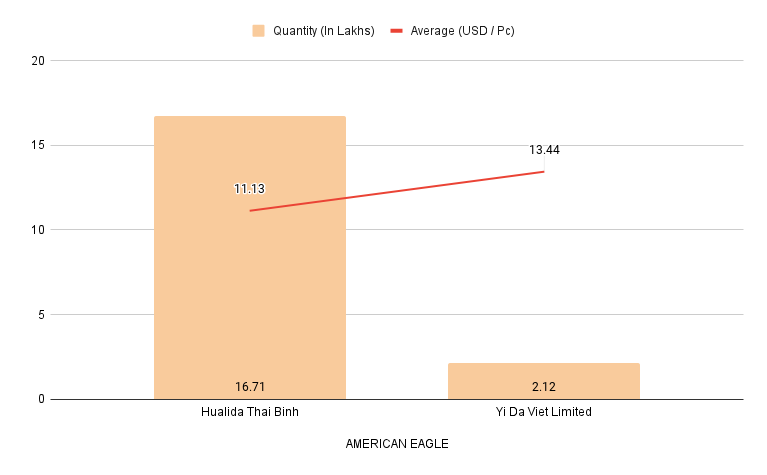
    • Hualida Thai Binh and Yi Da Viet Limited for American Eagle: Hualida Thai Binh supplied American Eagle with a significant quantity of 16.71 lakh pieces at an average price of $11.13 per piece. Yi Da Viet Limited supplied a smaller quantity of 2.12 lakh pieces but at a higher average price of $13.44 per piece, indicating a mix of volume and premium sourcing strategy.
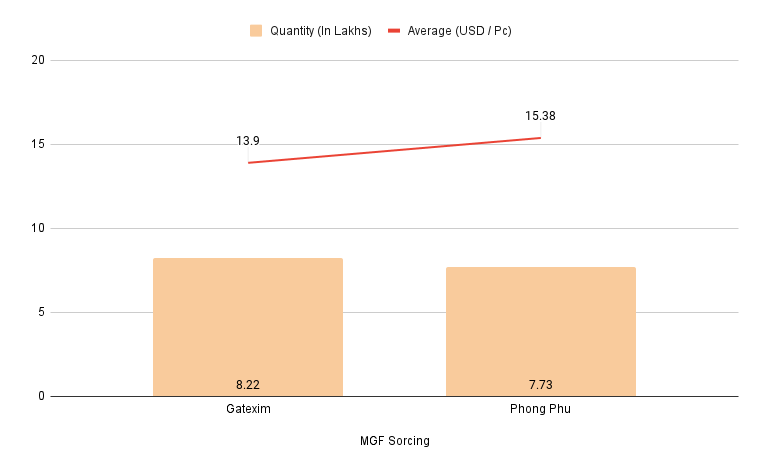
    • Gatexim and Phong Phu for MGF Sourcing: MGF Sourcing sourced 8.22 lakh pieces from Gatexim at $13.9 per piece and 7.73 lakh pieces from Phong Phu at a higher average price of $15.38 per piece, again suggesting a strategy focused on quality and premium positioning.
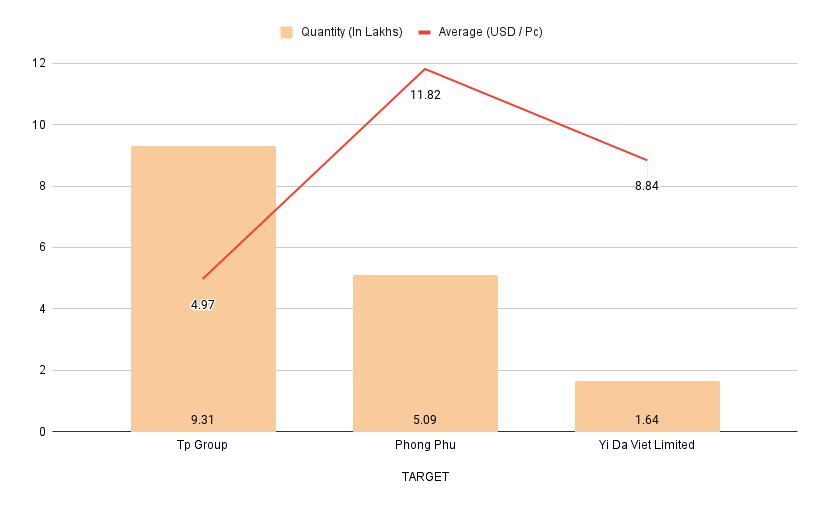
    • Tp Group and Yi Da Viet Limited for Target: Target worked with Tp Group for a supply of 9.31 lakh pieces at an average price of $4.97 per piece and with Yi Da Viet Limited for 1.64 lakh pieces at $8.84 per piece, balancing between high-volume value procurement and selective premium purchases.
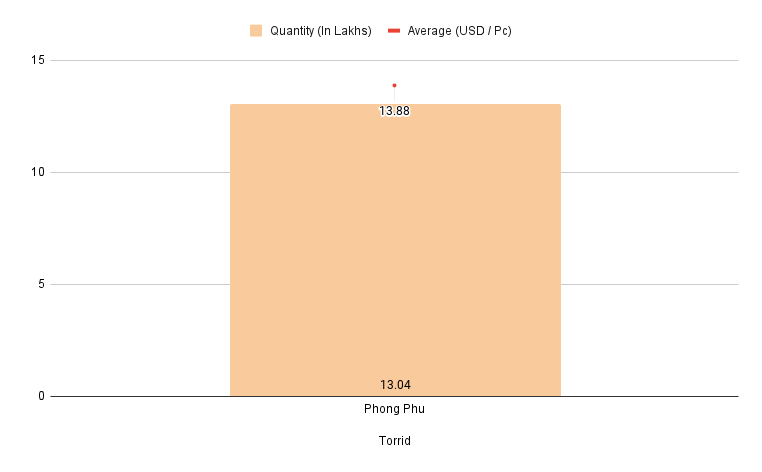
    • Phong Phu for Torrid: Torrid exclusively sourced from Phong Phu, with 13.04 lakh pieces at a consistent average price of $13.88 per piece, indicating a focused strategy on a singular source that meets their quality and pricing requirements.
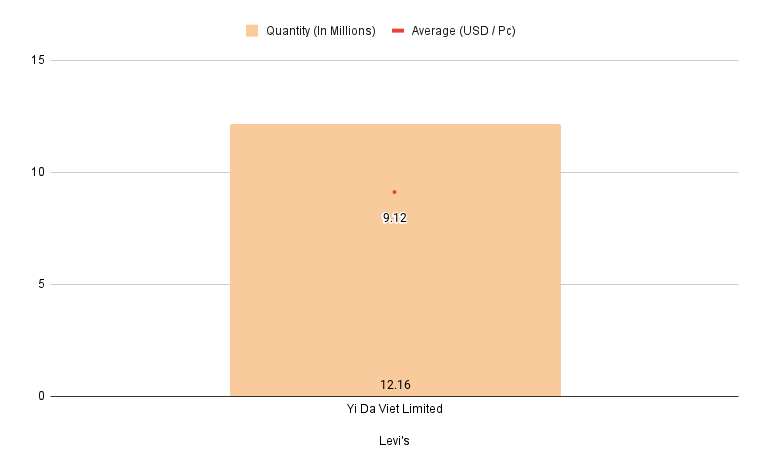
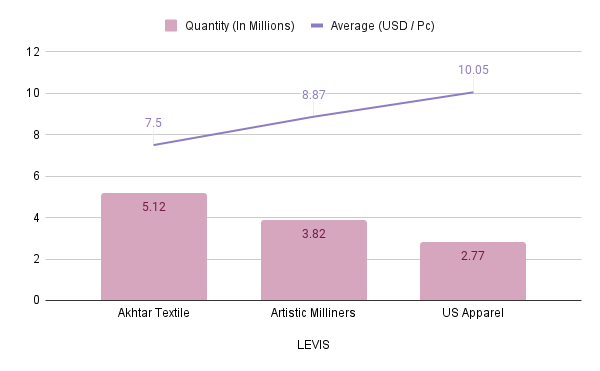
    • Yi Da Viet Limited for Levi’s: Levi’s, known for its premium denim, sourced 12.16 million pieces from Yi Da Viet Limited at a higher average price of $9.12 per piece, affirming its commitment to quality and brand reputation.

    Key Insights

    The analysis shows a diverse range of sourcing strategies among the top USA brands, with some opting for high-volume procurement at competitive prices and others focusing on higher-priced, premium-quality denim. The choice of suppliers and the average price points paid reflect each brand’s market positioning and customer base.


    In 2023, the collective efforts of the top 15 USA retail brands have culminated in a significant share of denim apparel imports from Vietnam, with a total purchase volume of nearly 12.9 million pieces. However, the actual quantities will be much higher given that many smaller exporters are not considered neither are other brands. [/private_special]

  • Top US Denim Brands Buying Jeans From Pakistan

    Top US Denim Brands Buying Jeans From Pakistan

    The denim trade between Pakistan and the United States is a significant aspect of the textile industry, shaping fashion trends and retail markets. This report provides an overview of the market shares of top brands importing denim from Pakistan to the US for the period of September 2022 to September 2023.

    One of the key highlights is that major US brands that we are studying accounted for an impressive 82% of the overall denim purchased from Pakistan. Get ready to explore the ins and outs of this dynamic denim industry!

    Market Share Breakdown Among Top 15

    [private_special]

    • Levi’s: Dominates the import market with a significant 32.4% share, highlighting its stronghold in the US denim sector.
    • Gap: Commands a notable 22.3% of the imports, reinforcing its position as a major player in the market.
    • Target: Follows with an 11% market share, emphasizing its competitive procurement strategy.
    • JC Penney and 5 Star Apparel: These brands secure considerable portions of the market with 10.8% and 3.6% respectively, showcasing their relevance in the denim import market.
    • Smaller but notable contributions come from brands such as H&M, Kontoor, and AL USA, each holding shares ranging from 2.8% to 3.6%, reflecting a diverse market with several active participants. Of course, H&M , Kontoor etc

    We will be focusing on this data to further analyze in details in the ensuing sections.

    TOP 15 COMPANIES BUYING DENIMS

    This section illuminates the purchasing habits of top US companies sourcing denim from Pakistan, offering a clear view of the quantities bought and the average prices paid.

    Leading Buyers

    • LEVIS: Evidently leading the pack, LEVIS has purchased a staggering 16.86 million units, indicating a strong demand for denim garments. However, the average price paid stands at USD 8.45 per unit, which is not the highest among the competitors, suggesting a balance between quality and cost-effectiveness.
    • GAP: Another major player, GAP, has secured 11.6 million units at an average price of USD 9.31 per unit. This higher price point could be indicative of GAP’s positioning towards quality or a specific product range in the denim segment.

    Market Trends

    • TARGET & JC PENNEY: Both of these retailers showcase a similar purchasing volume with TARGET buying 5.74 million units and JC PENNEY close behind at 5.61 million units. Their average prices are USD 8.91 and USD 9, respectively, again reflecting the industry’s trend towards a mid-range pricing strategy.

    Value-Focused Buyers

    • 5 STAR APPAREL & AL USA: With a more conservative quantity of 1.855 and 1.853 million units respectively, these buyers are spending less on average (USD 4.23 and USD 4.45), which may suggest a strategy targeting the value segment of the market.

    Premium Pricing Strategy

    • KONTOOR: At a lower volume of 1.69 million units but a higher average price of USD 9.96, KONTOOR appears to be pursuing a premium pricing strategy, likely focusing on higher-end denim garments.

    Consistent Buyers

    • H & M and MAMIYE BROTHERS: These two companies have procured lesser quantities of 1.43 and 1.31 million units but at healthy average prices of USD 8.12 and USD 5.55, signaling consistent market activity.

    Niche Market Participants

    • KAMDAR INDUSTRIES to EXPRESS: This group ranges from KAMDAR INDUSTRIES purchasing 0.97 million units to EXPRESS with 0.48 million units. However, it’s notable that the average prices here vary significantly, with EXPRESS paying a premium of USD 11.88 per unit, possibly indicating a specialized product demand or niche market strategy.

    TOP 3  GARMENT SUPPLIERS OF THESE BRANDS

    In this detailed analysis, we explore the principal Top 3 garment suppliers for notable Top 5 US retail brands. Leveraging the data provided on volumes and average prices, this section aims to paint a clearer picture of the procurement strategies and partnerships that define the denim garment supply chain from Pakistan to the United States.

    Artistic Milliners

    • Serves as a key supplier to multiple US brands, notable for providing large quantities of denim garments with varied pricing:
      • For LEVIS, they supplied 3.82 million units at an average of USD 8.87 per piece.
      • For GAP, they supplied 5.4 million units, with an average price of USD 10.19 per piece, indicating a premium product offering.
      • For TARGET, they are the leading supplier, delivering 3.81 million units at USD 9.2 per piece, highlighting a strong position in TARGET’s premium segment.

    Artistic Fabric

    • Another significant player, Artistic Fabric’s presence is felt across the spectrum of US retailers:
      • They have provided GAP with 6.01 million units at USD 8.57 per piece.
      • JC PENNEY sourced 1.69 million units from them at USD 9.7 per piece, showcasing their ability to cater to different market needs.

    US Apparel

    • This supplier has demonstrated versatility in serving both mass-market and niche segments:
      • Supplied LEVIS with 2.77 million units at the highest average price point of USD 10.05 per piece.
      • For TARGET, they delivered 1.12 million units at USD 9.99 per piece, reaffirming TARGET’s preference for higher-quality denim.

    The procurement of over 52 million units of denim by the top US companies from Pakistan represents a considerable majority of the nearly 63 million units acquired in total, underscoring the depth of trust and the quality of the textiles sourced. To conclude, the data indicates that the US denim market is driven by a combination of high-volume purchases and targeted, cost-effective sourcing methods. The diversity in purchasing volumes and average price points suggests a market that caters to a wide range of consumer needs and preferences.

    [/private_special]


    Check out the other reports below:

  • US Denim Imports From Vietnam In 2021

    US Denim Imports From Vietnam In 2021

    Vietnam is getting to be one of the most important countries when it comes to exports of denim. A number of large manufacturing units have been developed which are working for large retailers and brands. The FTA with the EU has further strengthened exports from the nation. However, the US continues to be the dominant region where exports are happening from Vietnam. In this report, we have done a detailed analysis of the imports of denim jeans from Vietnam into the US in 2021. The detailed report shows the imports by the US over this period.

    PARTICULARS
    Table showing top 15 US denim buyers from Vietnam in one year
    Graphs showing total jeans imported by Top 15 US buyers from Vietnam over 12 months
    Table showing the top 15 suppliers to the US from Vietnam
    Graphs showing the top 15 suppliers to the US from Vietnam
    Table showing the top three buyers of top ten suppliers

    1.TOP 15 US DENIM BUYERS FROM VIETNAM

    [private_special]

    The table shows that AEO bought the largest quantity which is 4.2 million pcs with an avg. price of 11.8 USD/piece and has approx. 11% of the total share, followed by GAP INC with approx. 4.1 million pcs and the avg. price of 10 USD/ piece in a year (from 1st Jan 2021- 31st December 2021) Total Percentage share of these 15 companies holds 71% of total jeans quantity imported into the US from Vietnam.

    BUYERQTY(in million)%SHAREAVG. PRICE(USD/pc)No. Of Suppliers
    AEO – AMERICAN EAGLE4.211111.87
    OLD NAVY / GAP4.1101010
    TARGET GLOBAL SOURCING LIMITED3.2889.73
    AMBIANCE APPAREL2.01551
    ABERCROMBIE & FITCH1.82593
    MGF SOURCING FAR EAST, LIMITED1.75412.13
    FASHION NOVA1.6245.22
    EXPRESS / MGF SOURCING1.38410.53
    LEVI STRAUSS1.29310.32
    TORRID MERCHANDISING, INC1.29313.21
    SHINSUN INVESTMENT HOLDING LTD1.0738.11
    HIDDEN JEANS / CELLO JEANS1.0635.72
    KANCAN WH1.0537.53
    Y.H.TEXPERT CORPORATION1.0133.93
    QUETICO LLC0.9626.92
    TOTAL27.97146
    Vietnam
    Buyer

    29% share is the total of other small companies apart from these 15 companies

    buyer

    2. TOP 15 DENIM SUPPLIERS TO US FROM VIETNAM

    PHONG PHU INTERNATIONAL JSC supplied the largest quantity of pieces that is approx. 9.9 million pieces with an avg. price of 11.6 USD/pc and the total number of buyers the company has dealt with are 31 followed by YDVL – YI DA VIETNAM LIMITED which is a part of the CRYSTAL group of HK with approx. 5.8 million pieces with an avg. price of 9.7 USD/pc .

    SUPPLIERQTY(in million)%SHAREAVG. PRICE(USD/pc)NO. OF BUYERS
    PHONG PHU INTERNATIONAL JSC9.942411.631
    YDVL – YI DA VIETNAM LIMITED5.82149.715
    NIEN HSING GARMENT (VIET NAM) CO., LTD3.9591122
    TRUC XANH CLOTHING ONE MEMBER COMPANY LIMITED3.3984.89
    KIM BINH GARMENT CO., LTD3.2889.95
    TCE JEANS COMPANY LIMITED2.9775.615
    GATEXIM – SAIGON 3 GARMENT JOINT STOCK COMPANY2.19512.49
    SAITEX INTERNATIONAL1.89520.723
    TCE CORPORATION1.5148.87
    SX-TM KIM SUN COMPANY LIMITED1.1137.14
    VIGAWELL GARMENT TRADING COMPANY LIMITED1.1139.210
    JUNZHEN GARMENT COMPANY LIMITED1.0738.11
    TEXHONG THAI BINH GARMENT COMPANY LIMITED0.9921111
    VITAJEAN CO.,LTD0.4417.42
    QUANG NAM BLUE WAY ONE MEMBER CO., LTD0.2415.71
    TOTAL39.99510.1165
    US
    avg. price

    Apart from these 15 companies, there are also a few other companies holding a 5% share of the total.

    %share

    3. Top Three Buyers Of Top Ten Vietnam Suppliers

    PHONG PHU INTERNATIONAL JSC

    The company has been growing consistently and in 12 years they have grown to one of the leading apparel manufacturers in Vietnam and are supplying known US and European Retailers.

    BUYERQTY(in million)AVG. PRICE(USD/pc)
    TARGET GLOBAL SOURCING LIMITED2.069.2
    MGF SOURCING FAR EAST, LIMITED1.4812.2
    TORRID MERCHANDISING, INC1.2913.2

    YDVL – YI DA VIETNAM LIMITED

    YDVL is a part of the Crystal Group of Hong Kong. Crystal International Group Limited was founded in Hong Kong in 1970 and is now with 20 apparel manufacturing facilities in Asia employing approximately 70,000 people worldwide. They provide comprehensive one-stop solutions to international brands covering lifestyle wear, denim, intimate, sweater, and sportswear and outdoor apparel..

    BUYER QTY(in million) AVG. PRICE(USD/pc)
    OLD NAVY1.299.7
    LEVI STRAUSS1,.2810.3
    TARGET1.2110.6

    NIEN HSING GARMENT (VIET NAM) CO., LTD

    NIEN HSING TEXTILE CO., LTD. is a Taiwan-based company principally engaged in the manufacture and distribution of garments and textile products. The products of the Company include denim and casual wear, denim cloth, casual cloth, and ring-spun yarns. Their main clients are GAP, AEO, Kohl’s, VF, others In Vietnam Garment/Knitwear

    BUYER QTY(in million) AVG. PRICE(USD/pc)
    GAP INC0.6110.5
    ABERCROMBIE & FITCH0.347.8
    EXPRESS USA0.3413.6

    TRUC XANH CLOTHING ONE MEMBER COMPANY LIMITED

    They are engaged in the export of apparel.

    BUYER QTY(in million) AVG. PRICE(USD/pc)
    FASHION NOVA1.625.2
    Y.H.TEXPERT CORPORATION1.103.9
    HIDDEN JEANS / CELLO JEANS0.755.2

    TCE JEANS COMPANY LIMITED

    As one of the oldest denim factories in Asia, TCE has been trusted by customers since 1956 for its long history of stable quality & customization. The largest fabric capacity in Vietnam is 3.5 million yds/month And garment- 1.3 million pcs/month Number 1 vertically integrated denim supplier from fabric to washing in southern Asia by full sustainability.

    BUYER QTY(in million) AVG. PRICE(USD/pc)
    AMBIANCE APPAREL2.05.0
    HIDDEN JEANS / CELLO JEANS0.326.7
    H & M HENNES & MAURITZ AB0.144.5

    KIM BINH GARMENT CO., LTD

    Kim Binh Minh Co., Ltd was established in 2001, located in Ho Chi Minh City, Vietnam. As a manufacturer and exporter to Japanese and USA markets, they specialize in producing apparel products.

    BUYER QTY(in million) AVG. PRICE(USD/pc)
    OLD NAVY / GAP1.8710.4
    ABERCROMBIE & FITCH1.409.3

    SAITEX INTERNATIONAL

    Saitex is one of the most well-known denim factories around the world. It has also been sometimes classified as the ” Cleanest denim factory “. With a very strong focus on sustainability, Saitex is employing most of the clean technologies for its denim apparel production. The company also became the first factory in Asia and the only large-scale manufacturer of denim with B Corporation™ Certification, a score of 105.6 .

    BUYER QTY(in million) AVG. PRICE(USD/pc)
    MADEWELL INC0.8418.5
    EVERLANE0.3625.9
    J CREW0.2723.0

    GATEXIM – SAIGON 3 GARMENT JOINT STOCK COMPANY

    GATEXIM – Saigon 3 Garment Joint Stock Company is one of the leading garment exporters in Vietnam, specializing in all kinds of jeans, khaki pants, and sports pants with a total output of more than 12 million units,2 garment factories, 1 completing center, 3,000 machinery equipment, 47 sewing lines, 3,000 skilled workers. The export market includes Japan, USA, Europe, Asia. Saigon 3 always concentrates on the quality of products and services towards the satisfaction of customers, as the foundation of the company.

    BUYER QTY(in million) AVG. PRICE(USD/pc)
    EXPRESS / MGF SOURCING FAR EAST, LIMITED0.9212.2
    GTEX INC.,0.3211.2
    3RD TR8 APPAREL, INC0.3714.1

    TCE CORPORATION

    Founded in South Korea in 1956, TCE is one of the oldest denim companies in Asia. It relocated its entire production to Vietnam in 2014 and now produces only denim at its TCE Vina Denim mill, which occupies a 110,000m² site two hours outside of Hanoi. It has the largest capacity fabric in Vietnam of 3.5 million yards per month. In garments they have two units TCE VINA DENIM with 300,000 pcs per month and TCE JEANS with 1 million pcs per month. TCE exports 100% of its production overseas, with Europe, at about 45% being the largest market, followed by the USA at 30%, and Japan and Korea the other main export destinations.

    BUYER QTY(in million) AVG. PRICE(USD/pc)
    KANCAN WH1.007.5
    CHICOS RETAIL0.3011.7
    TCE CORPORATION0.2111.2

    SX-TM KIM SUN COMPANY LIMITED

    SX-TM KIM SUN is a garment processing factory that supplies, manufactures, trades, and processes in the field of apparel, clothing, footwear, products, and articles using fabric materials and finishing products. domestically and internationally 

    BUYER QTY(in million) AVG. PRICE(USD/pc)
    INTRO FABRIC0.876.9
    THE M.A.P INC.0.178.1

    [/private_special]

  • US Denim Imports Recover In 2021

    US Denim Imports Recover In 2021

    In this report, a detailed analysis has been done of total denim imports into US from different countries in the first quarters of 2019, 2020, and 2021 each. As we check the quantum of imports of denim jeans into US over the first quarter of three years, we find how the quantity went down in 2020 and then recovered in 2021 – providing positive signals to the industry.

    Besides other information, the report contains the following :

    PARTICULARS
    Table showing total denim imports in 1st quarter of 2019,2020 and 2021
    Graphs showing total denim imports
    Table showing denim imports in 2019
    Graphs showing denim imports in 2019
    Table showing denim imports in 2020
    Graphs showing denim imports in 2020
    Table showing denim imports in 2021
    Graphs showing denim imports in 2021
    [private_special]

    1.TOTAL IMPORTS IN FIRST QUARTER OF 2019, 2020 AND 20201

    Total imports of denim in the 1st quarter of 2019, 2020 and 2021 was 280 million pieces with an avg. price of USD 8.16. Highest imports of denim in last three years was in 2019 of 102 million pieces which fell to 86 million pieces in 2020 because of the pandemic. But now the situation is getting better and we can see that impact in the first quarter of 2021 Denim imports rose to 93 million pieces with the avg. price of USD 7.9 . The price is still subdued due to the consumer sentiment but expected to improve over the year .

    YEARQUANTITY IN MILLIONAVG. PRICE
    20191028.25
    2020868.35
    2021937.9
    TOTAL2808.16

    2.COUNTRYWISE DENIM IMPORTS IN 2019 IN THE FIRST QUARTER

    The total import of denim in 2019 in the first quarter was 102 million pieces at an average price of USD 8.25. China and Mexico exported the highest number of denim with a total volume of about 23.02 million pieces at an average price of 8.21 and 22 million pieces at an avg. price of 8.83 respectively. Together they had almost 45 % share of the market in US.

    COUNTRYQUANTITY IN MILLIONAVG PRICE%SHARE
    China23.028.2122.57
    Mexico22.098.8321.66
    Bangladesh15.566.9115.26
    Pakistan7.967.967.8
    Vietnam7.568.627.41
    Indonesia3.076.633.01
    Sri Lanka1.588.851.55
    Madagascar1.474.621.44
    India1.119.091.08
    Colombia1.0912.191.07
    Turkey0.6315.360.61
    Ethiopia0.635.150.62
    Mauritius0.2714.650.26
    Japan0.2416.50.23
    Hong Kong0.059.160.05
    Others168.6515.37
    TOTAL1028.25100

    3.DENIM IMPORTS IN 2020 IN THE FIRST QUARTER

    Compared to 2019, 2020 imports were affected as expected , and the decreased in quantity. The total import of denim in 2020 in the first quarter was around 85 million pieces at an average price of USD 8.35. Bangladesh and Mexico exported the highest quantum of denim with a total volume of about 19 million pieces at an average price of USD7.08 and 14 million pieces at an avg. price of USD 9.7 respectively. Because of the pandemic, China’s exports decreased by more than 50 % in 2020 – that is from 23 million pieces to only 9.12 million pieces. Also its market share fell from 22% to less than 10% . Bangladesh increased its market share from 15% to 22% . Mexico also lost share in the market. Hence the biggest gainer in the pandemic was Bangladesh. Pakistan also gained some share in the pandemic year.

    COUNTRYQUANTITY IN MILLIONAVG PRICE%SHARE
    Bangladesh19.047.0822.16
    Mexico14.329.716.67
    Vietnam10.138.6611.79
    China9.127.7510.62
    Pakistan8.947.3210.41
    Sri Lanka2.108.742.44
    Indonesia1.568.321.81
    Madagascar1.265.941.47
    India1.089.21.26
    Ethiopia0.875.041.01
    Turkey0.7115.240.83
    Colombia0.6511.830.76
    Japan0.2222.660.26
    Mauritius0.0919.660.11
    Hong Kong0.025.680.02
    OTHER15.768.9118.34
    GRAND TOTAL85.898.35100

    4.DENIM IMPORTS IN 2021 IN THE FIRST QUARTER

    Many countries suffered a great loss of exports in 2020 but slowly in 2021 recovery signs can be seen. Compared to 2020, 2021 import results are much better. The total import of denim in 2021 in the first quarter was around 92 million pieces at an average price of USD 7.90. Bangladesh and Mexico exported the highest volume even in 2021, with a total volume of about 20 million pieces at an average price of USD 6.88 and 15 million pieces at an avg. price of USD 9.42 respectively. China that was affected by the pandemic is now slowly recovering by increasing its exports of the first quarter to 11 million pieces.

    COUNTRYQUANTITY IN MILLIONAVG PRICE%SHARE
    Bangladesh20.886.8822.57
    Mexico15.469.4216.71
    China11.046.4811.94
    Pakistan10.257.1111.08
    Vietnam9.068.519.8
    Sri Lanka1.958.82.11
    Madagascar1.945.522.09
    India1.118.091.2
    Turkey0.9714.481.05
    Ethiopia0.9251
    Indonesia0.918.110.98
    Colombia0.4211.70.46
    Japan0.2423.070.25
    Mauritius0.0714.540.07
    Hong Kong0.033.660.04
    OTHERS17.258.4218.64
    GRAND TOTAL92.517.90100

    With the recovery in the first quarter of 2021, it is evident that recovery has started and we are going to witness much better figures in this year and beyond . US and Europe are both opening up and the sales are picking up and we expect that we might see probably the best results in last 5 years assuming covid does not create another wave in the world.

    [/private_special]

  • Cambodia Exports Of Denim To USA  Expected To Grow Faster Than Pakistan In 2018

    Cambodia Exports Of Denim To USA Expected To Grow Faster Than Pakistan In 2018

    In this report, we have :

    1. Analysed the Denim Exports along with average price and growth in the exports of Pakistan & Cambodia to USA for 2013-18 ( June’18)
    2. Segmented the total denim exports into Women & Men Denim and analysed the same for the aforesaid period .
    3. Comprehensive analysis of growth in the exports of both the countries along with the changes in the average price of Mens and Womens Denim .

    Table Showing Exports of All Denim Apparels along with Growth Rates  To USA From 2013 to June 2018 By Pakistan And Cambodia.

    Graph Showing Exports of All Denim Apparels(Million Pcs) To USA From 2013 To June 2018 by Pakistan And Cambodia
    Graph Showing Export Growth Rates Of Pakistan & Cambodia From 2013- 2018
    Table Showing Average Price All Denim Apparels Exported To USA From 2013 to June 2018 By Pakistan & Cambodia
    Graph Showing Average Price All Denim Apparels Exported To USA From 2013 to June 2018 By Pakistan & Cambodia

    Table Showing Mens & Womens Denim Exported To USA By Pakistan & CambodiaFrom 2013- 2018

    Graph Showing Mens & Womens Denim Exported To USA By Pakistan & Cambodia From 2013- 2018
    Table Showing  Average Price Of Mens & Womens Denim Exported To USA By Pakistan & CambodiaFrom 2013- 2018
    Graph Showing Average Price Of Mens & Womens Denim Exported To USA By Pakistan & Cambodia From 2013- 2018

    [private_special]

    Exports of All Denim Apparels To USA From 2013 to June 2018 By Pakistan & Cambodia

    The growth trends for Pakistan in the denim exports to the USA post year 2013 has been very encouraging and in 2018 , the country is expected to register the growth upto 23% subject to the consistency of momentum  throughout the year . The country is expected to export over 30  million denim apparels to the USA at an average price of USD 8.4/Pc. If all goes well for Pakistan , then by the end of 2019 the country might reach to the export of 40 million pcs which will be close to the double of what it exported in 2013 . In the 1st half of 2018 , the country has exported 15.78 million pcs of denim apparels to the USA.

    On the contrary, Cambodia is on downslide  post 2013 and falling consistently and the reasons are plentiful for the same including political , social and others. . The country witnessed many labor related issues and instability which adversely affected the production and so the exports also . But the 1st half of 2018 has produced good results so far and the country has reached to the export figure of 9.01 million pcs and if the pace will be like this only for the whole year , the country may see the biggest surge in exports after 2013 . The country is expected to have the growth of upto 45% by the end of 2018. Before 2018 , the growth figures  remained close to constant by every passing year and in 2017 , the country’s export fell down by 17% however the early trend for 2018 is a sign of good recovery.

    Exports of Denim Apparel From Pakistan To US 2013-18

    Years

    All Denim Apparel

    ( Million Pcs)

    P A K I S T A N

    % Growth

    All Denim Apparel

    ( Million Pcs)

    CAMBODIA

    % Growth

    2013

    20.58

    15.34

    2014

    21.06

    2%

    15.29

    -0.32%

    2015

    21.86

    4%

    15

    -2%

    2016

    23.51

    8%

    14.93

    0.47%

    2017

    25.73

    9%

    12.44

    -17%

    2018 ( Till June)

    15.78

    9.01

    2018 ( Projected)

    31.56

    23%

    18.02

    45%

    Cambodia’s Export Of Denim To USA Is Expected To Grow Faster Than Pakistan In 2018 | Denimsandjeans

    Cambodia’s Export Of Denim To USA Is Expected To Grow Faster Than Pakistan In 2018 | Denimsandjeans

    Prices

    The average price of both the countries have separate equations and trends. On one hand , where Pakistan’s average price has been increasing , Cambodia’s has been falling. In 2014 , the average price of Pakistan was USD 7.9/Pc and the average price of Cambodia was USD 8.57/Pc . However in 2018 , Pakistan closes with the increase of USD 0.50/PC and Cambodia with the decrease of approx. USD 1/Pc . This also reflects Pakistan’s growing competence and its ability to export more value added products while Cambodia still remains a basic denim exporter.

    Year

    Average Price ( USD/Pc)

    P A K I S T A N

    Average Price ( USD/Pc)

    C A M B O D I A

    2014

    7.9

    8.57

    2015

    8.1

    8.52

    2016

    8.34

    7.82

    2017

    8.69

    7.69

    2018

    8.4

    7.58

    Cambodia’s Export Of Denim To USA Is Expected To Grow Faster Than Pakistan In 2018 | Denimsandjeans

    Mens & Womens Denim Exported To USA By Pakistan & Cambodia From 2013- 2018

    We can immediately understand that Cambodia is more into exports of Women’s Denim Garment however Pakistan has a balanced production for both the categories . However , even for Pakistan, the quantity of women denim shipped is more than that of men’s.  In 2013 , the ratio of Womens: Mens for Pakistan was 56:44 and by the end of 2018 , the ratio is expected to have at 57:43 – not much change over the years ! . For Cambodia , the share of women denim in the total export has been rising . In 2013 , women denim accounted for 68% of share in total export however by the end of 2018 , it is expected to reach at the level of upto 81% in the total exports.

    Year

    Women Denim ( Mil Pcs)

    P A K I S T A N

    Mens Denim ( Mil Pcs)

    P A K I S T A N

    Women Denim ( Mil Pcs)

    C A M BO D I A

    Mens Denim ( Mil Pcs)

    C A M BO D I A

    2013

    11.45

    9.13

    10.43

    4.91

    2014

    11.87

    9.19

    9.95

    5.34

    2015

    11.63

    10.24

    10.52

    4.48

    2016

    12.85

    10.4

    11.38

    3.49

    2017

    13.72

    11.93

    10.18

    2.14

    2018- Projected

    17.86

    13.54

    14.52

    3.36

    Cambodia’s Export Of Denim To USA Is Expected To Grow Faster Than Pakistan In 2018 | Denimsandjeans

    Cambodia’s Export Of Denim To USA Is Expected To Grow Faster Than Pakistan In 2018 | Denimsandjeans

    Average Price Of Men’s & Women’s Denim Exported To USA By Pakistan & Cambodia From 2013- 2018

    So far as the average price of both the categories are concerned , Women Denim is costlier than Men’s on an average basis for Pakistan however for Cambodia , the average price of both Women and mens denim have been becoming more competitve agaisnt each other. In 2018 , the men’s denim average price for Pakistan was USD 7.69/Pc but for Women’s Denim it was was USD 8.97/Pc which proves that Womens denim is still better value added than that of  Mens Denim.

    For Cambodia , the womens and mens denim have had fluctuations over the years on the average price In 2018 , the average price for Mens Denim Export is USD 8.6/Pc and for Womens Denim Export , it is USD 7.68/Pc.

    Year

    Women Denim ( USD/PC)

    P A K I S T A N

    Mens Denim ( USD/PC)

    P A K I S T A N

    Women Denim (USD/PC)

    C A M BO D I A

    Mens Denim ( USD/PC)

    C A M BO D I A

    2013

    8.76

    6.91

    8.2

    9.35

    2014

    8.68

    6.89

    8.14

    9.24

    2015

    8.6

    7.54

    7.53

    8.51

    2016

    8.66

    8.05

    7.34

    8.86

    2017

    8.9

    8.46

    7.44

    8.5

    2018

    8.97

    7.69

    7.68

    8.6

    Cambodia’s Export Of Denim To USA Is Expected To Grow Faster Than Pakistan In 2018 | Denimsandjeans

    Cambodia’s Export Of Denim To USA Is Expected To Grow Faster Than Pakistan In 2018 | Denimsandjeans


    [/private_special]

  • US Shows 5 Percent Growth In Imports of Denim In 2018

    US Shows 5 Percent Growth In Imports of Denim In 2018

    Denim industry, looking for a good news for sometime, finally seems to have some. The denim apparel imports into US showed a 6% growth in 2018 . Since the beginning of this year , we have been witnessing growth in imports and the pace has picked up in the second quarter. This growth is specially interesting as it comes on top of an increase in average price of imports by over 4% . Since the year 2010 when the imports into US were at their peak , the market has slackened and could never attain that peak. Year 2018 is again showing a shimmer of hope that the US market might finally be on strong positive path and try to cross milestones it did in last decade.

    Imports Of Denim Apparel In US ( 2017 H1 vs 2018 H1)

    Period Quantities (million pcs) Value (million U $) Av. Price US$/pc Volume Growth % Price Growth %
    2017 (Jan to Aug) 295 2,310 7.83
    2018 (Jan to Aug ) 310 2,533 8.17 5 % 4.3%


    image

    The US economy is seeing its strongest growth in many decades – it grew 4.2% in 2nd Quarter of 2018 . The growth is likely to be strong in the near future as per most experts.   The strengthening US$ has also added to the improved situation of imports making it easier for the buyers to get a better price and sellers to realize better margins.  On the whole, a positive situation for the global denim industry specially considering that EU market is also going strong !

  • Denim Imports Into US From AGOA, ASEAN, Latin America, EU and CAFTA Regions

    In this report ,we analyse how the different trade groups/regions  of the world are faring when exporting their denim apparel to US in 2017 vs 2016. These regions include the ASEAN, AGOA, CAFTA, EU27 and Latin America. We also analyze the comparative growth in exports from these regions in the two years and their relative % shares.

    Table Of Contents

    S N.

    Particulars

    1.

    Table showing the exports of all denim apparels(men+women) along with the average price into USA from different regions in 2017 and 2016

    2.

    Graph showing the comparison in  exports of all denim apparels(men’s+women’s)into USA from different regions in 2017 and 2016

    3.

    Graph showing the comparison of average price of all denim apparels(men’s+women’s) into USA from different regions in 2017 and 2016

    4.

    Graph showing the percentage share in exports of all denim apparels(mes’s+women’s) into USA from different regions in 2017 and 2016

    5.

    Table showing the exports of men’s jeans along with the average price into USA from different regions in 2017 and 2016

    6.

    Graph showing the comparison in  exports of men’s jeans into USA from different regions in 2017 and 2016

    7.

    Graph showing the comparison of average price of men’s jeans into USA from different regions in 2017 and 2016

    8.

    Graph showing the percentage share in exports of men’s jeans into USA from different region in 2017 and 2016

    9.

    Table showing the exports of women’s jeans along with the average price into USA from different regions in 2017 and 2016

    10.

    Graph showing the comparison in exports of women’s jeans into USA from different regions in 2017 and 2016

    11.

    Graph showing the comparison of average price of women’s jeans into USA from differnt regions in 2017 and 2016

    12.

    Graph shwing the percentage share in exports of women’s jeans into USA from different regions in 2017 and 2016

    [private_special]

    1. All Denim Apparels

    a. In 2017

    The exports of all denim apparels into USA from different countries shows that Latin America was the largest exporter of denims with about 131 million pcs with the average price of usd 8.16 per pc,in 2016 and with the decrease of 11% it fell to about 119 million pcs with the average price of usd 8.23 per pc, in 2017 . ASEAN(Second largest exporter) followed with about 47 million pcs and the average price of usd 8.27 per pc in 2016 which saw an increase of 7% to about 50 million pcs and an average price of usd 8.16  per pc. in 2017. The third largest exporter was AGOA where the exports in the year 2016 was 21.50 million pcs with the average price of usd 7.37 per pc and with the decrease of 6% the exports went down to about little more than 20 million pcs with the average price of usd 7 per pc in 2017. CAFTA and EU 27 were the lowest exporters with about 20 million pcs and 1 million pcs in the year 2017 of which CAFTA saw an decrease of 7% . However EU 27 saw an increase of 30% in 2017.
    Among Latin American countries, Mexico is the main country which exports to US and has the lion’s share . However, on the whole, we see a fall in exports from all these regions put together. AGOA , though losing this year, might gain next year as Ethiopia steams up and exports more and more denim apparel to US . ASEAN was the biggest gainer in export growth.

    EXPORTING REGION YEAR OF IMPORT ALL DENIM APPAREL

    (MILLION PCS)

    TOTAL VALUE

    (MILLION USD)

    AVERAGE PRICE

    (USD/PC)

    LATIN AMERICA 2017 118.42 1,000.82 8.45
    ASEAN 2017 50.29 410.44 8.16
    AGOA 2017 20.28 141.97 7.00
    CAFTA 2017 18.46 131.79 7.14
    EU27 2017 1.21 29.49 24.33
    TOTAL 2017 208.66 1,714.51 8.22

    b. In 2016

    EXPORTING COUNTRY YEAR OF IMPORT ALL DENIM APPAREL 

    (MILLION PCS)

    TOTAL VALUE

    (MILLION USD)

    AVERAGE PRICE

    (USD/PC)

    LATIN AMERICA 2016 130.66 1,075.53 8.23
    ASEAN 2016 46.66 385.83 8.27
    AGOA 2016 21.50 158.41 7.37
    CAFTA 2016 19.82 144.76 7.30
    EU27 2016 0.90 25.67 28.52

    TOTAL

    2016

    219.54

    1,790.20

    8.


    Comparison Of Exports Of All denim Apparels Into USA From Different Regions In 2017 And 2016

    Comparison Of Exports Of All denim Apparels Into USA From Different Regions In 2017 And 2016

    The percentage share in the exports of all denim apparels into USA from above mentioned different regions in 2017 shows that LATIN AMAERICA was the largest exporter of all denim apparels with 57% of the total exports followed by ASEAN where the exports was 24% , further AGOA, CAFTA, EU27 contributes somewhere between 9% and 10% respectively.

    Comparison Of Exports Of All denim Apparels Into USA From Different Regions In 2017 And 2016

    The percentage share in exports of all denim apparels into USA from the above mentioned  different region in 2016 shows that LATIN AMERICA was the largest exporter with 60% of the exports, followed by ASEAN with 21% of the exports further AGOA and CAFTA shared 10% and 9% of the exports respectively.

    Comparison Of Exports Of All denim Apparels Into USA From Different Regions In 2017 And 2016

    2. Men’s Jeans

    a.In 2017

    The exports of men’s jeans into USA from different regions shows that LATIN AMERICA was the largest exporter of men’s jeans and with about  117 million pcs and an average price of usd 7.92 per pc in 2016 which saw an fall of 10% to about  106 million pcs with an average price of usd 8.08 per pc in 2017, followed by AGOA(Second largest) where the exports was little more than 15 million pcs with an average price of usd 7.64 per pc in 2016 which saw an increase of 7 % to about little more than 16 million pcs with an average price of usd 7.26 per pc in 2017 .Further ASEAN contributes little more than  14 million pcs  and CAFTA contributes close to 15 million pcs in 2016 and saw an fall of about 4% and 9% it went down to 14 million pcs and 13 million pcs respectively in 2017. On the whole, there is a fall of about 12 million men jeans in 2017 when we compare with figures for 2016 . All the regions have reduced their exports and only AGOA and EU 27 seems to have increased exports of men’s jeans a little.

    EXPORTING REGION

    YEAR OF IMPORT

    MEN’S/BOYS JEANS

    (MILLION PCS)

    TOTAL VALUE

    (MILLION USD)

    AVERAGE PRICE

    (USD/PC)

    LATIN AMERICA

    2017

    105.52

    852.47

    8.08

    AGOA

    2017

    16.15

    117.19

    7.26

    ASEAN

    2017

    13.69

    114.74

    8.38

    CAFTA

    2017

    13.36

    96.4

    7.22

    EU27

    2017

    0.92

    20.29

    21.96

    TOTAL

    2017

    149.64

    1201.09

    8.03

    b. In 2016

    EXPORTING REGION

    YEAR OF IMPORT

    MEN’S/BOYS JEANS

    (MILLION PCS)

    TOTAL VALUE

    (MILLION USD)

    AVERAGE PRICE

    (USD/PC)

    LATIN AMERICA

    2016

    116.53

    922.88

    7.92

    AGOA

    2016

    15.14

    115.70

    7.64

    CAFTA

    2016

    14.58

    109.44

    7.51

    ASEAN

    2016

    14.27

    123.66

    8.67

    EU27

    2016

    0.63

    17.89

    28.63

    TOTAL

    2016

    161.15

    1289.57

    8.00


    Comparison Of Exports Of All denim Apparels Into USA From Different Regions In 2017 And 2016

    Comparison Of Exports Of All denim Apparels Into USA From Different Regions In 2017 And 2016

    The percentage share in exports of men’s jeans into USA from different regions in 2017 shows that, LATIN AMERICA contributes is the largest exporter of men’s jeans with 70% of the total exports, AGOA was the second largest exporter with 11 % in exports, CAFTA and ASEAN contributes 9 % in exports whereas EU 27 contributes 1% in exports in 2017.

    Comparison Of Exports Of All denim Apparels Into USA From Different Regions In 2017 And 2016

    The percentage share in exports of men’s jeans into USA for different regions in 2016 shows that Latin America contributes almost two – third in exports of men’s jeans with 72% of the exports, further AGOA, CAFTA, ASEAN contributes between 10% and 9% respectively.

    Comparison Of Exports Of All denim Apparels Into USA From Different Regions In 2017 And 2016

    3. Women’s Jeans

    a. In 2017

    The exports of women’s jeans into USA from different regions shows that ASEAN was the largest exporter of women’s jeans with about close to 32 million pcs and an  average price of usd 8.10 per pc in 2016, which saw an increase of 13% to about little more than 36 million pcs with an average price of usd 8.09 per pc in the year 2017. LATIN AMERICA was the second largest exporter with 14 million pcs and an average price of usd 10.80 per pc in 2016 which saw an fall of 8% to about close to 13 million pcs and an average price of usd 11.50 per pc in 2017 . CAFTA and AGOA had almost the same exports in the year 2016 and also in the year 2017 . Pricing wise, LATIN AMERICA seems expensive compared to CAFTA and ASEAN. EU is expectedly most expensive exporter because of their high fashion local made products which are expensive. ASEAN countries seem best placed to supply the high fashion women jeans – something which Latin American companies are not able to do and have high costs.

    EXPORTING REGION YEAR OF IMPORT WOMEN’S/GIRLS JEANS

    (MILLION PCS)

    TOTAL VALUE

    (MILLION USD)

    AVERAGE PRICE

    (USD/PC)

    ASEAN 2017 36.11 292.13 8.09
    LATIN AMERICA 2017 12.84 147.61 11.50
    CAFTA 2017 5.09 35.26 6.93
    AGOA 2017 4.13 24.78 6.00
    EU27 2017 0.28 8.38 30.37
    TOTAL 2017 58.45 508.16 8.69

    b. In 2016

    EXPORTING REGION

    YEAR OF IMPORT

    WOMEN’S/GIRLS JEANS

    (MILLION PCS)

    TOTAL VALUE

    (MILLION USD)

    AVERAGE PRICE

    (USD/PC)

    ASEAN

    2016

    31.91

    258.55

    8.10

    LATIN AMERICA

    2016

    14.02

    151.35

    10.80

    AGOA

    2016

    6.36

    42.67

    6.71

    CAFTA

    2016

    5.21

    35.19

    6.76

    EU27

    2016

    0.26

    6.83

    25.87

    TOTAL

    2016

    57.76

    494.59

    8.56


    Comparison Of Exports Of All denim Apparels Into USA From Different Regions In 2017 And 2016

    Comparison Of Exports Of All denim Apparels Into USA From Different Regions In 2017 And 2016

    The percentage share in exports of women’s jeans into USA from different regions in 2017 shows that ASEAN was the largest exporter and contributes more than 60% (against 55% in 2016) of the total exports followed by LATIN AMERICA which contributes about 22% further AGOA and CAFTA contributes about 9% and 7% of the total exports in the year 2017.

    Comparison Of Exports Of All denim Apparels Into USA From Different Regions In 2017 And 2016

    The percentage share in exports of women’s jeans into USA from different regions in 2016 shows that ASEAN shares the largest and contributes  55% of the total exports followed by LATIN AMERICA with 24% in the total exports . AGOA, CAFTA, and EU 27 contributes 11% , 9% , and 1% respectively.

    Comparison Of Exports Of All denim Apparels Into USA From Different Regions In 2017 And 2016

    [/private_special]

  • China Vs Pakistan | Denim Exports To USA From 2013 To 2017

    China Vs Pakistan | Denim Exports To USA From 2013 To 2017

    China and Pakistan are two importer exporters of jeans to US . While China has had a long headstart, Pakistan is catching up . When we look at different segment exports and prices , interesting aspects emerge. The report below provides data to analyse the competition between the two countries.

    Table Of Contents

    S N.

    Particulars

    1.

    Table showing the imports of all denim apparels along with the average price into USA from  China and Pakistan for the period from 2013 to 2017

    2.

    Graph showing the comparison of  imports of all denim apparels into USA from China and Pakistan for the period from  2013 to 2017

    3.

    Graph showing the comparison of average price of all denim apparels into USA from China and Pakistan for the period from 2013 to 2017

    4.

    Table showing the imports of men’s jeans along with the average price into USA from China and Pakistan for the period from 2013 to 2017

    5.

    Graph showing the comparison of imports of  men’s jeans into USA from China and Pakistan for the period from 2013 to 2017

    6.

    Graph showing the comparison of average price of men’s jeans into USA from China and Pakistan for the period from 2013 to 2017

    7.

    Table showing the imports of women’s jeans along with the average price into USA from China and Pakistan for the period from 2013 to 2017

    8.

    Graph showing the comparison of imports of women’s jeans into USA from China and Pakistan for the period from 2013 to 2017

    9.

    Graph showing the comparsion of average price of women’s jeans into USA from China and Pakistan for the period from 2013 to 2017

    1. All Denim Apparels

    a. China

    [private_special]

    China has been the largest exporter of jeans to US for many years. However, of late, it has been losing steam as it gets more expensive and less competitive. If we see the figures from 2013 to 2017, we find that Chinese exports have gone down more than 20% in this period . This shows slackening hold of Chinese exports to US. However, if we still consider, China is the largest supplier of jeans and denim apparel to US. Looking at Pakistan, we find that though their base is small , they have increased their sales to US by over 20% in this period. So whereas China has reduced their exports by 20% , Pakistan has gained by 20% . But still, China exports over 5 times the quantity what Pakistan exports and is a force to reckon with.

    Exporting Country

    Year of Import

    All Denim Apparel

    (Million Pcs)

    Total Value

    (Million USD)

    Average Price

    (USD/PC)

    China

    2013

    155.23

    1,230.48

    7.93

    China

    2014

    135.37

    996.67

    7.36

    China

    2015

    133.13

    1,001.15

    7.52

    China

    2016

    123.58

    958.01

    7.75

    China

    2017

    119.72

    928.02

    7.75

    b. Pakistan

    Exporting Country Year of Import All Denim Apparel

    (Million Pcs)

    Total Value

    (Million USD)

    Average Price

    (USD/PC)

    Pakistan 2013 20.58 163.37 7.94
    Pakistan 2014 21.06 166.37 7.90
    Pakistan 2015 21.86 177.16 8.10
    Pakistan 2016 23.51 196.13 8.34
    Pakistan 2017 25.73 223.50 8.69


    Comparison of Imports of All Denim Apparels Into USA From China And Pakistan For The Period 2013To 2017

    When we look at price comparison, we find that prices of Pakistan jeans and other denim apparel has been higher than that of China when we consider as a whole. However, the situation might change if we look at men and women segment separately.

    Comparison of Imports of All Denim Apparels Into USA From China And Pakistan For The Period 2013To 2017

    2. Men’s Jeans

    a. China

    China is not very strong in Men’s jeans. Its men’s segment forms just about 25% of total exports to US whereas that of women is about 75 % . This shows that speed and quick fashion is what the Chinese exporters are specializing in . However, exports of men’s jeans did not fall too much over 4 years from about 37 million pieces to 32 million pcs.

    Exporting Country Year of Import Men’s/Boys Jeans

    (Million Pcs)

    Total Value

    (Million USD)

    Average Price

    (USD/PC)

    China 2013 36.88 286.63 7.77
    China 2014 30.84 236.53 7.67
    China 2015 31.13 247.96 7.97
    China 2016 32.87 261.50 7.96
    China 2017 32.27 247.66 7.68

    b. Pakistan

    Pakistan , on the other hand , has a balanced portfolio with men’s segment forming about 45-50% of total exports to US. The growth in this segment has been good and at about 40% from 2013 to 2017.

    Exporting Country Year of Import Men’s/Boys Jeans

    (Million Pcs)

    Total Value

    (Million USD)

    Average Price

    (USD/PC)

    Pakistan 2013 9.13 63.10 6.91
    Pakistan 2014 9.19 63.36 6.89
    Pakistan 2015 10.24 77.18 7.54
    Pakistan 2016 10.40 83.72 8.05
    Pakistan 2017 11.93 100.90 8.46


    Comparison of Imports of All Denim Apparels Into USA From China And Pakistan For The Period 2013To 2017

    Its interesting to see that men’s jeans average price from Pakistan has been lower than that of China.  This shows the strength of Pakistan lies in Men’s segment and that is why this segment is growing well for it .

    Comparison of Imports of All Denim Apparels Into USA From China And Pakistan For The Period 2013To 2017

    3. Women’s Jeans

    a. China

    The Women’s jeans has been the mainstay for China in denim exports and constitutes 75% of its exports to US. However, the volumes have been going down and we can see a fall of about 30% in this segment in the period of 2013-2017. This is not a good sign even though the overall volumes are still good.

    Exporting Country Year of Import Women’s/Girls Jeans

    (Million Pcs)

    Total Value

    (Million USD)

    Average Price

    (USD/PC)

    China 2013 118.36 943.84 7.97
    China 2014 104.53 760.14 7.27
    China 2015 102.00 753.19 7.38
    China 2016 89.10 683.73 7.67
    China 2017 85.46 664.96 7.78

    b. Pakistan

    Pakistan’s exports of jeans include about 50-55% women jeans. This quantity has been increasing over the years and we can see a growth of about 20% in this segment as well. But when we look at the price graph below, we find that the prices of jeans exported from China are cheaper than that of Pakistan over many years. China’s strength does lie in women segment.

    Exporting Country Year of Import Women’s/Girls Jeans

    (Million Pcs)

    Total Value

    (Million USD)

    Average Price

    (USD/PC)

    Pakistan 2013 11.45 100.28 8.76
    Pakistan 2014 11.87 103.01 8.68
    Pakistan 2015 11.63 99.97 8.60
    Pakistan 2016 12.85 111.36 8.66
    Pakistan 2017 13.72 122.1 8.90

    On the whole, we can say that China is going down the hill and Pakistan is going up . The two shall meet somewhere in between in the coming years . Its ADVANTAGE PAKISTAN…

    Comparison of Imports of All Denim Apparels Into USA From China And Pakistan For The Period 2013To 2017

    Comparison of Imports of All Denim Apparels Into USA From China And Pakistan For The Period 2013To 2017

    [/private_special]

  • US Imports Of Denim From AGOA | 2012-2016

    US Imports Of Denim From AGOA | 2012-2016

    AGOA provides duty-free and quota-free treatment for eligible apparel articles made in qualifying sub-Saharan African countries until September 30, 2025. Qualifying articles include: apparel made of U.S. yarns and fabrics; apparel made of sub-Saharan African (regional) yarns and fabrics until September 30, 2025, subject to a cap; apparel made in a designated lesser-developed country of third-country yarns and fabrics until September 30, 2025, subject to a cap; apparel made of yarns and fabrics not produced in commercial quantities in the United States; textile or textile articles originating entirely in one or more lesser-developed beneficiary sub-Saharan African countries; certain cashmere and merino wool sweaters; and eligible hand loomed, handmade, or folklore articles, and ethnic printed fabrics.

    It can be said, with little exaggeration, that Lesotho owes the very existence of its fairly substantial clothing and textile industry to AGOA and exports to the U.S. Although there was an established infant clothing industry in Lesotho prior to the introduction of AGOA, growth was nothing short of spectacular following the introduction of AGOA, brought about mainly as a result of investment by Taiwanese companies to take advantage of the duty free quota-free access to the U.S. market. Employment in the industry grew from 9847 in 1999 to 53087 in 2004 with a globally-integrated industry producing garments for some of the best known brands in the world, such as Gap and Levi Strauss. Like garment manufacturers located in many countries around the world, Lesotho’s clothing industry experienced a major decline following the demise of the MFA in 2005. The situation was worsened by the strong appreciation of the Loti (which is linked to the Rand) against the US$.

    In this report, we did a detailed analysis of US Imports of Denim from the major countries fall under AGOA region.

    Table of Content

    S.NO.

    Particulars

    1 Table showing the list of top exporting countries to USA with quantity and average price for the period of 2012 -2016
    2 8 Tables showing the  top four exporting countries to USA with quantity for the period of 2012 -2016
    3 8 Tables showing the  top four exporting countries to USA with average price for the period of 2012 -2016
    4 8 Graphs showing the  top four exporting countries to USA with quantity for the period of 2012 -2016
    5 8 Graphs showing the  top four exporting countries to USA with average price for the period of 2012 -2016


    At this time, it does not appear that Africa will grow into a world-class supplier of denim by the end of the decade, although the region may rise as a significant producer of jeans and other denim apparel. As the continent grows under the African Growth and Opportunity Act (AGOA), and continues to receive investment from China, India, and elsewhere, cut and sew operations will take center stage, but imported fabrics will largely support this production. In part, this will be driven by the fact that the AGOA agreement makes it much more economical to import cloth than to buy it locally.

    Summary of Exports from AGOA to USA 2012-2016 | Qty In Million pcs | Avg Price(USD/Pc)       [private_special]

    Country

    2012

    2013

    2014

    2015

    2015 (Jan-Sept)

    2016 (Jan-Sept)

    Qty Exported

    Avg Price

    Qty Exported

    Avg Price

    Qty Exported

    Avg Price

    Qty Exported

    Avg Price

    Qty Exported

    Avg Price

    Qty Exported

    Avg Price

    Lesotho

    14.78

    6.79

    14.78

    6.65

    13.76

    6.38

    14.03

    6.43

    10.67

    6.39

    7.79

    6.70

    Kenya

    3.59

    6.21

    3.48

    6.64

    3.96

    7.29

    3.64

    7.87

    2.77

    7.91

    2.44

    8.26

    Madagascar

    0.43

    1.87

    1.19

    2.02

    1.07

    2.96

    2.14

    4.01

    1.50

    3.55

    1.91

    6.37

    Mauritius

    0.85

    11.72

    0.88

    14.44

    2.65

    13.78

    2.09

    13.63

    1.46

    13.61

    0.90

    14.25

    Tanzania

    0.00

    0.00

    0.01

    3.67

    0.16

    7.88

    0.30

    8.46

    0.22

    8.51

    0.44

    7.94

    There is an improvement in terms of export of denim to USA by AGOA in last four years. In 2012 , the total export was 19.79 Million Pcs while in 2015 it reached to 22.27 Million Pcs . So far as the average prices are concerned , several countries under this region managed to deliver a competitive price . Madagascar is the lowest priced exporter with average prices in 2016 coming to only about USD 3.55 per piece which is extremely low ! . Mauritius is the highest priced with average prices going beyond USD 13 per piece as it serves mainly the high end market . Lesotho is definitely the market leader when it comes to volumes and has over 60% of the export share.

    LESOTHO

    There is an improvement in terms of export of denim to USA by AGOA in last four years. In 2012 , the total export was 19.79 Million Pcs while in 2015 it reached to 22.27 Million Pcs .  Lesotho is the leading country with 14.03 million pcs in 2015 which is actually less than the exports of 2013 and 2012. During the period of Jan-Sept 2015, the export quantity for Lesotho was 10.67 million pcs however for the same period in 2016 registered an adverse of growth of 27% and the quantity exported shrink to 7.79 million pcs. However the changes in the average prices are reasonably well comparing with the change in the quantity. In 2012 , the average price was USD 6.79/Pc which has been merely decreased by 36 cents and reached to USD 6.43/Pc in 2015. Comparing the period of Jan-Sept of 2015 &2016 , it was observed in spite of downfall in the quantity exported there were no as such increase in average price. The average price increased from USD 6.39/Pc to USD 6.70/Pc.

    Qty Exported To USA(In Millions)

    Year

    2012

    2013

    2014

    2015

    Lesotho

    14.784

    14.784

    13.764

    14.028

    US Imports Of Denim From AGOA | Denimsandjeans

    Avg Price (USD/Pcs)

    Year

    2012

    2013

    2014

    2015

    Lesotho

    6.79

    6.65

    6.38

    6.43

    US Imports Of Denim From AGOA | Denimsandjeans

    Qty Exported To USA(In Millions)

    Year

    2015 (Jan-Sept)

    2016 (Jan-Sept)

    Lesotho

    10.668

    7.788

    US Imports Of Denim From AGOA | Denimsandjeans

    Avg Price (USD/Pcs)

    Year

    2015 (Jan-Sept)

    2016 (Jan-Sept)

    Lesotho

    6.39

    6.70

    US Imports Of Denim From AGOA | Denimsandjeans


    KENYA

    Kenya is the second leading country with 3.636 million pcs in 2015 which is actually less than the exports of 2014. During the period of Jan-Sept 2015, the export quantity for Kenya was 2.772 million pcs however for the same period in 2016 registered an adverse of growth of 12% and the quantity exported shrink to 2.436 million pcs. However the changes in the average prices are reasonably well comparing with the change in the quantity. In 2012 , the average price was USD 6.21/Pc which has been increased by USD 1.66/Pc  and reached to USD 7.87/Pc in 2015. Comparing the period of Jan-Sept of 2015 &2016 , it was observed that downfall in the quantity exported led to increase in average price. The average price increased from USD 7.91/Pc to USD 8.26/Pc.

    Qty Exported To USA(In Millions)

    Year

    2012

    2013

    2014

    2015

    Kenya

    3.588

    3.48

    3.96

    3.636

    US Imports Of Denim From AGOA | Denimsandjeans

    Avg Price (USD/Pcs)

    Year

    2012

    2013

    2014

    2015

    Kenya

    6.21

    6.64

    7.29

    7.87

    US Imports Of Denim From AGOA | Denimsandjeans

    Qty Exported To USA(In Millions)


    Year

    2015 (Jan-Sept)

    2016 (Jan-Sept)

    Kenya

    2.772

    2.436

    US Imports Of Denim From AGOA | Denimsandjeans

    Avg Price (USD/Pcs)

    Year

    2015 (Jan-Sept)

    2016 (Jan-Sept)

    Kenya

    7.91

    8.26

    US Imports Of Denim From AGOA | Denimsandjeans


    MADAGASCAR

    Madagascar is one of the growing country with 2.136 million pcs in 2015 which is actually reasonably better than than the exports of 2013 and 2012. During the period of Jan-Sept 2015, the export quantity for Madagascar  was 1.5 million pcs however for the same period in 2016 registered a positive growth of 27% and the quantity exported reached to 1.908 million pcs. In 2012 , the average price was only USD 1.87/Pc which has been increased to USD 4.01/Pc in 2015.

    Qty Exported To USA(In Millions)

    Year

    2012

    2013

    2014

    2015

    Madagascar

    0.432

    1.188

    1.068

    2.136

    US Imports Of Denim From AGOA | Denimsandjeans

    Avg Price (USD/Pcs)

    Year

    2012

    2013

    2014

    2015

    Madagascar

    1.87

    2.02

    2.96

    4.01

    US Imports Of Denim From AGOA | Denimsandjeans

    Qty Exported To USA(In Millions)

    Year

    2015 (Jan-Sept)

    2016 (Jan-Sept)

    Madagascar

    1.5

    1.908

    US Imports Of Denim From AGOA | Denimsandjeans

    Avg Price (USD/Pcs)

    Year

    2015 (Jan-Sept)

    2016 (Jan-Sept)

    Madagascar

    3.55

    6.37

    US Imports Of Denim From AGOA | Denimsandjeans


    MAURITIUS

    Mauritius is not a big player when it comes to exports to US. It mainly works in EU market and there also it seems to be not doing well because of rising costs and increased competition. However, for US market under AGOA , Mauritius has increased its exports and reached a number of 2 million plus for 2015. However, there is again de-growth when it comes to 2016 – so the exports are not steady.

    Qty Exported To USA(In Millions)

    Year

    2012

    2013

    2014

    2015

    Mauritius

    0.852

    0.876

    2.652

    2.088

    US Imports Of Denim From AGOA | Denimsandjeans

    Avg Price (USD/Pcs)

    Year

    2012

    2013

    2014

    2015

    Mauritius

    11.72

    14.44

    13.78

    13.63

    US Imports Of Denim From AGOA | Denimsandjeans

    Qty Exported To USA(In Millions)

    Year

    2015 (Jan-Sept)

    2016 (Jan-Sept)

    Mauritius

    1.464

    0.9

    US Imports Of Denim From AGOA | Denimsandjeans

    Avg Price (USD/Pcs)

    Year

    2015 (Jan-Sept)

    2016 (Jan-Sept)

    Mauritius

    13.61

    14.25

    US Imports Of Denim From AGOA | Denimsandjeans


    On the whole we see that AGOA could not really serve the purpose what it sought to achieve specially when it comes to denim. The exports have been more or less stagnant with not much signs of improvement. Ethiopia is a country where there is a lot of hope , however, the country has till now not been able to get its act together and export . It is still under development stage and still does not have the kind of infrastructure ready to enable exports in a sizeable way. Maybe we should see figures worth while looking at when , hopefully when we report again !

    [/private_special]


    Save the dates of our upcoming International Denim Exhibitions In Bangladesh and Vietnam .

    Denim Mashup | Street Style

  • Exports Of Denim Fabric By Mexico | 2015-2016

    Exports Of Denim Fabric By Mexico | 2015-2016

    Serial No Particulars

    1

    Table Showing Export Of Denim Fabric ( Million Sq Mtr) By Mexico For YTD June 2016

    2

    Graph Showing Export Of Denim Fabric ( Million Sq Mtr) By Mexico For YTD June 2016

    3

    Pie Chart Showing % Share In The Export Of Denim Fabric Made By Mexico For YTD June 2016

    4

    Table showing Average Price of Export Of Denim Fabric Made By Mexico For YTD June 2016

    5

    Graph Showing Average Price of Export Of Denim Fabric Made By Mexico For YTD June 2016

    6

    Table Showing Export Of Denim Fabric ( Million Sq Mtr) By Mexico In 2015

    7

    Graph Showing Export Of Denim Fabric ( Million Sq Mtr) By Mexico In 2015

    8

    Pie Chart Showing % Share In The Export Of Denim Fabric Made By Mexico In 2015

    9

    Table showing Average Price of Export Of Denim Fabric Made By Mexico In 2015

    10

    Graph showing Average Price of Export Of Denim Fabric Made By Mexico In 2015


    Mexico’s economy has performed well relative to other major Latin American economies in recent years, largely because of its thriving manufacturing sector. Unlike Brazil and Argentina, whose manufacturing sectors are slumping, Mexico has continued to see solid growth because of its integration with and dependence on the U.S. market. Although low global oil prices will put pressure on Mexico’s economy, the performance of the manufacturing sector — especially in high-end manufacturing — will be a key driver of Mexico’s economic growth this year and beyond.

    Analysis:

    In the late 1980s and early 1990s, Mexico underwent a profound economic and political reorganization. The economy liberalized, culminating in the North American Free Trade Agreement. Major state-owned companies privatized, transforming Mexico from a closed economic and political system into an export-oriented industrial economy. As a result, trade increased between Mexico and the United States, and a manufacturing belt sprung up at the countries’ shared border. From 1990 to 2000, Mexican trade became even more closely tied to the United States. In 1990, the United States accounted for 69 percent of all Mexican trade; by 2000, it accounted for nearly 80 percent.

    But at the turn of the century, China’s special economic zones became cost-competitive alternatives to Mexican factories. Mexico responded by making more valuable products, such as automotive, aeronautical and electronic products. Thus, even though clothing exports dropped 43 percent (from $7.6 billion to $4.3 billion) between 2002 and 2012, automotive exports increased by 152 percent ($27.9 billion to $70.3 billion) and electronic exports increased by 73 percent ($43.3 billion to $74.9 billion) over the same period. Asian alternatives to high-end products notwithstanding, these Mexican products remained cost-competitive because of NAFTA.

    Moreover, rising wages in China have once again shifted the equation in global manufacturing. Average manufacturing labor costs in Mexico are now almost 20 percent lower than in China, whereas in 2000, Mexico’s labor costs were 58 percent more expensive than China’s. All these reasons again make it comeback story for Mexico and we see a resurgence of exports to US including apparel. In this report we did a detailed analysis of Export of Denim Fabric By Mexico For the year 2015 and YTD June 2016 . We will see how Mexico how and where is Mexico exporting its denim fabrics and at what prices. Normally it is believed that US should be the largest market for Mexican denim fabrics. Is it so ? Maybe not !

    Denim-Mashup Mail2---

    [private_special]

    Export Of Denim Fabric ( Million Sq Mtr) By Mexico For YTD Jan-June 2016

    S.No

    Country

    Sq Mtr ( Million)

    1

    Nicaragua 

    7.363

    2

    U.S.A

    5.259

    3

    Colombia 

    0.753

    4

    Dominican Republic

    2.285

    5

    Peru

    0.201

    6

    Turkey

    0.462

    7

    Bolivia 

    0.101

    8

    Poland

    0.481

    9

    South Africa

    0.038

    10

    Egypt

    0.084

    Mexico has exported approx. 17.775 million square mtr of total denim fabric for YTD June 2016 out of which 7.363 million square mtr and 5.259 million square mtr of denim fabric exported to Nicaragua and United States Of America respectively . The third highest exporting destination for Mexico is Dominicana with 2.285 million square mtr.


    Export Of Denim Fabric By Mexico | June 2016

    Export Of Denim Fabric By Mexico | June 2016


    Average Price of Export Of Denim Fabric Made By Mexico For YTD Jan-June 2016

    S.No

    Country

    Av Price per sq mtr

    1

    Nicaragua 

    1.85

    2

    U.S.A

    1.97

    3

    Colombia 

    2.14

    4

    Dominican Republic

    2.14

    5

    Peru 

    2.21

    6

    Turkey

    2.40

    7

    Bolivia 

    2.49

    8

    Poland

    2.48

    9

    South Africa

    2.30

    10

    Egypt

    2.29

    Nicaragua is the least expensive exporting destination and the average price at which the exports are made is USD 1.85/ Sq Mtr . USA is second with the average price of USD 1.97/Sq Mtr. Bolivia is the most expensive country with the average price of USD 2.49/Sq Mtr.

    Export Of Denim Fabric By Mexico | June 2016


    Export Of Denim Fabric ( Million Sq Mtr) By Mexico In 2015

    S.No

    Country

    Sq Mtr ( Million)

    1

    Nicaragua 

    16.416

    2

    U.S.A

    8.558

    3

    Colombia

    2.972

    4

    Dominican Republic

    4.031

    5

    Peru 

    0.883

    6

    Turkey

    0.146

    7

    Bolivia 

    0.528

    8

    Poland

    0.995

    9

    South Africa

    0.609

    10

    Egypt

    1.370

    Mexico has exported approx. 40.48 million square mtr of total denim fabric in 2015 out of which 16.416 million square mtr and 8.558 million square mtr of denim fabric exported to Nicaragua and United States Of America respectively . The third highest exporting destination for Mexico is Dominicana with 4.031 million square mtr.

    Export Of Denim Fabric By Mexico | June 2016

    Export Of Denim Fabric By Mexico | June 2016


    Average Price of Export Of Denim Fabric Made By Mexico In 2015

    S.No

    Country

    Avg Price

    1

    Nicaragua

    1.77

    2

    U.S.A

    2.27

    3

    Colombia 

    2.10

    4

      Dominican Republic

    2.09

    5

    Peru 

    2.40

    6

    Turkey

    2.81

    7

    Bolivia

    2.58

    8

    Poland

    2.41

    9

    South Africa

    2.11

    10

    Egypt

    2.27

    Nicaragua is the least expensive exporting destination and the average price at which the exports are made is USD 1.77/ Sq Mtr . Dominicana is the second least expensive with the average price of USD 2.27/Sq Mtr. Turquia is the most expensive country with the average price of USD 2.81/Sq Mtr.

    Export Of Denim Fabric By Mexico | June 2016


    [/private_special]

  • Imports Of Denim Fabrics For Consumptions By USA| Year-To-Date from Jan–May,2015-16

    Imports Of Denim Fabrics For Consumptions By USA| Year-To-Date from Jan–May,2015-16

    Serial No.

    Particulars

    1

    Table Showing Comparative Figures Of Imports Of Denim Fabrics For Consumptions By USA For January to May 2015 &2016 ( In Million Sq Mtrs)

    2

    Graph Showing Comparative Figures Of Imports Of Denim Fabrics For Consumptions By USA For January to May 2015 &2016 .

    3

    Table Showing Comparative Average Price Of Imports Of Denim Fabrics For Consumptions By USA For January to May 2015 &2016 ( USD/Sq Mtr)

    4

    Graph Showing Comparative Average Price Of Imports Of Denim Fabrics For Consumptions By USA For January to May 2015 &2016

    5

    Table Showing Imports Of Denim Fabrics For Consumptions By USA From 2012-2015 and  its % share in 2015 . ( In Million Sq Mtrs)

    6

    Graph Showing Imports Of Denim Fabrics For Consumptions By USA From 2012-2015 and  its % share in 2015 . ( In Million Sq Mtrs)

    7

    Pie Chart showing % share of countries in the imports of Denim Fabrics For Consumption By USA in 2015.

    8

    Table Showing Average Price Of  Imports Of Denim Fabrics For Consumptions By USA From 2012-2015 .( USD/Sq Mtrs)

    9

    Line Graph Showing Average Price Of  Imports Of Denim Fabrics For Consumptions By USA From 2012-2015 .

    10

    Table Showing Imports Of Denim Fabrics For Consumptions By USA From 2012-2016 ( Jan To May 2016) ( In Million Linear Mtrs)

    11

    Graph Showing Imports Of Denim Fabrics For Consumptions By USA From 2012-2016 ( Jan To May 2016)

    12

    Table Showing Av Price Of Imports Of Denim Fabrics For Consumptions By USA From 2012-2016 ( Jan To May 2016)( USD/Linear Mtrs)

    13

    Graph Showing Av Price Of Imports Of Denim Fabrics For Consumptions By USA From 2012-2016 ( Jan To May 2016)

    In our previous report, We did an analysis of the major denim apparel exporting countries to USA for Jan-May 2016 . In this report , we have done a detailed analysis of the major denim fabrics exporting countries to USA for Jan-May 2016.

    In the year 2015 ( Jan-May) , China exported 4.33 million square meters of denim fabrics to USA and achieved a growth of 10.60% for the same period in 2016 and the export quantity was 4.79 million square meters. However, the eye catching figure is of Mexico , which grew by 43.30% in Jan-May 2016 compared to Jan-May 2015 . In 2015 , it exported 2.57 million square meters while in the next year for the same period , it exported 3.69 million square meters. Other countries like Japan showed a downfall of -4.60 % however Turkey shown a positive growth of 1.40% in Jan-May 2016.

      US Imports For Consumption Of Fabrics For YTD 2015-16 (table) 

    [private_special]

    Country

    2015 YTD

    2016 YTD

    % Change
    YTD2015 – YTD2016

    China

    4.33

    4.79

    10.60%

    Mexico

    2.57

    3.69

    43.30%

    Japan

    1.57

    1.50

    -4.60%

    Turkey

    0.87

    0.88

    1.40%

    Taiwan

    1.02

    0.63

    -38.60%

    India

    0.80

    0.59

    -25.50%

    Italy

    0.85

    0.36

    -57.70%

    image

    Looking at the average price of Imports to USA, we find India the least expensive which  exported the fabrics at the average price of USD 1.22/ Sq Mtr & USD 1.20/Sq Mtr In Jan-May 2015 and 2016 respectively. Japan is the most expensive amongst all the countries and it exported the fabric at the average price of USD 6.92/Sq Mtr & USD 6.31/Sq Mtr for 2015 and 2015 respectively. After comparing the average price for the both period , we can draw this conclusion that average price for all the countries fell down in Jan-May 2016 and Italy is the biggest looser amongst all.

      Average Price Of US Imports For Consumption Of Fabrics For Jan – May 2015-16

    Country

    Jan- May 2015
    (USD/ Sq mtr)

    Jan- May 2016
    (USD/ Sq mtr)

    % Change | YTD 2015-2016

    China

    2.18

    2.08

    -4.53%

    Mexico

    2.05

    1.87

    -8.73%

    Japan

    6.92

    6.31

    -8.78%

    Turkey

    5.49

    5.14

    -6.32%

    Taiwan

    2.13

    2.13

    0.13%

    India

    1.22

    1.20

    -1.45%

    Italy

    4.97

    4.56

    -8.25%

    image

    Further to the figures of 2016 , it would also be very pertinent to see what happened in the last three years and how the different countries have been performing  in relation to their denim fabric exports to US. China has been the exporting the highest quantity of fabric to US for last several years , though Mexico has been growing more rapidly than China . Still china managed to keep it position at the top . However in the year 2013 and 2014 , China has shown a downfall in the export quantities. In the year 2015 China exported 10.476 million square meters of denim fabric at the average price of USD 2.17/Sq Mtr accounted 38.88% share in the total export made to US by top exporting countries. Mexico exported 6.315 million sq mtr of denim fabrics to US in 2015 at the average price of USD 2.11/Sq Mtr accounted 23.44% share in the total export. India is the least expensive exporter at $1.26/ sq mtr of fabric over the years and Japan is the most expensive one at $6.75/sq mtr.

       U.S. Imports for Consumption Of Fabrics 2012-2015

    In Million Sq Mtrs

    Country

    2012

    2013

    2014

    2015

    % Share In 2015

    China

    12.41

    11.833

    8.631

    10.476

    38.88%

    Mexico

    6.676

    5.538

    4.09

    6.315

    23.44%

    Japan

    2.072

    3.052

    3.564

    3.395

    12.60%

    Turkey

    1.724

    2.048

    1.438

    1.979

    7.34%

    Taiwan

    3.195

    2.624

    2.12

    1.731

    6.42%

    India

    0.735

    0.747

    0.389

    1.643

    6.10%

    Italy

    2.717

    2.219

    2.371

    1.407

    5.22%

    image

    image

      Average Price Of  Imports Of Denim Fabric 2012-2015

    (USD/Sq Mtrs)

    Country

    2012

    2013

    2014

    2015

    China

    2.07

    2.29

    2.29

    2.17

    Mexico

    2.28

    2.13

    2.14

    2.11

    Japan

    7.03

    6.76

    6.67

    6.75

    Turkey

    6.14

    5.80

    6.01

    5.42

    Taiwan

    2.13

    2.14

    2.12

    2.11

    India

    1.39

    1.34

    1.26

    1.27

    Italy

    5.29

    5.15

    5.14

    4.96

    image


    The below analysis has been done in Linear Mtrs while the above have done in Sq Mtrs.

    Imports Of Denim Fabrics In USA From 2012-2016

    (Million Linear  Mtrs assuming standard width of 1.5mtr)

    Country

    2012

    2013

    2014

    2015

    2015 YTD

    2016 YTD

    China

    8.27

    7.89

    5.75

    6.98

    2.88

    3.19

    Mexico

    4.45

    3.69

    2.73

    4.21

    1.72

    2.46

    Japan

    1.38

    2.03

    2.38

    2.26

    1.05

    1.00

    Turkey

    1.15

    1.37

    0.96

    1.32

    0.58

    0.59

    Taiwan

    2.13

    1.75

    1.41

    1.15

    0.68

    0.42

    India

    0.49

    0.50

    0.26

    1.10

    0.53

    0.40

    Italy

    1.81

    1.48

    1.58

    0.94

    0.56

    0.24

    image

    Average Price Of Imports Of Denim Fabrics In  USA From 2012-2016

    (USD/Million Linear  Mtrs)

    Country

    2012

    2013

    2014

    2015

    2015 YTD

    2016 YTD

    China

    3.10

    3.44

    3.43

    3.25

    3.27

    3.12

    Mexico

    3.42

    3.20

    3.21

    3.16

    3.08

    2.81

    Japan

    10.54

    10.14

    10.00

    10.12

    10.38

    9.47

    Turkey

    9.20

    8.70

    9.02

    8.14

    8.24

    7.71

    Taiwan

    3.19

    3.21

    3.18

    3.16

    3.19

    3.19

    India

    2.08

    2.02

    1.90

    1.90

    1.83

    1.80

    Italy

    7.94

    7.72

    7.71

    7.45

    7.46

    6.84

    image

    If we look at the total figures of denim fabric imports into US in the last four years , we will find that the fabric imports reduced from 30 million sq. mtrs in 2012 to 23 million sq mtrs in 2014. However, there has been a revival in 2015 to 27 million sq mtrs. Also in 2016 the first five months show an improvement of about 3% in import quantities. This augurs well for the market and is also indicative that more activity is taking place in this market whether it is for re-export of fabrics or for local consumption. However, what is heartening to see is that Mexico is performing well on this count and is exporting its own fabrics to US in an increasing way.

    2012 – 30 million mtr approx.

    2013- 28 million mtrs approx.

    2014 – 23 million mtrs approx.

    2015- 27 million mtrs approx .

    [/private_special]

  • Exports Of Denim To USA Show Different Patterns From Exporting Countries Jan-May 2016

    Exports Of Denim To USA Show Different Patterns From Exporting Countries Jan-May 2016

    Exports of Denim apparel to US from different countries around the world has show varied patterns but on the whole the imports in the period Jan – May  2016 were down by over 5%. The exports fell most from Sri Lanka and rose most from Vietnam to USA as we can see in the table below.  The exports from China and Mexico also fell though Mexico felt more heat due to its 8.2% fall.


    Imports of Denim Apparel Into US : Jan – May 2016 vs Jan-May 2015


    Country

    Percent Change
    2016 vs 2015 (Jan- May)


    China

    -1.3%


    Mexico

    -8.2%


    Bangladesh

    10.4%


    Pakistan

    8.8%


    Vietnam

    22.8%


    Egypt

    -13.1%


    Nicaragua

    14.5%


    Cambodia

    -2.6%


    Lesotho

    -18.0%


    Indonesia

    13.8%


    Sri Lanka

    -22.6%


    Jordan

    -0.1%


    India

    -7.3%


    Kenya

    2.5%


    Colombia

    -0.8%


    All Other:

    -5.2%


    Further to the figures of 2016 , it would also be imperative to see what happened in the last three years and how the different countries have been performing  in relation to their denim exports to US. We bifurcate the exports from these countries in the Men’s and Women’s category and analyse how each of the major exporter is performing in these categories.

    Men’s Denim

    In 2013 and 2015 , Mexico exported  109.12 & 101.74 million pcs respectively, however there was a slight downfall of 6.8% in the export quantity in 2015 . Except Pakistan, all the countries followed the downward trends in 2015. The largest downfall has been registered by China which was 15.6% in 2015 . It is only Pakistan which managed to keep an increasing trend with a growth of 12.2% in 2015 as compared to 2013.

       Top Exporters Of Men’s Jeans To USA In Year 2013 & 2015 ( Pcs In Millions )

    Country

    2013

    2015

    MEXICO

    109.12

    101.74

    BANGLADESH

    46.09

    41.29

    CHINA

    36.88

    31.13

    EGYPT

    11.21

    10.6

    PAKISTAN

    9.13

    10.24

    VIETNAM

    6.54

    5.75

    image

    In 2013 , Bangladesh was the least expensive with the average price of USD6.24/pc while Vietnam was the most expensive with USD9.14/pc. In 2015 , Bangladesh exported at the lowest average price to USA that is only USD6.09/pc  and the Egypt became the most expensive exporter to USA at the average price of USD9.42/pc.

      2. Average Price Of Top Exporters Of Men’s Jeans To USA In 2013 &2015 ( USD/ Pc)

    Country

    2013

    2015

    MEXICO

    8.58

    8.45

    BANGLADESH

    6.24

    6.09

    CHINA

    7.77

    7.97

    EGYPT

    8.13

    9.42

    PAKISTAN

    6.91

    7.54

    VIETNAM

    9.14

    9.02

    image

    Analyzing the percentage change in the Quantity exported and percentage change in the average price between 2013 and 2015 , we will observe that except Pakistan ,no country has upward trend towards quantity change . Mexico , who was the leader exporter of Men’s Jeans to USA in 2013 and 2015 , has a negative growth in qty as well as in average price. Percentage change in the quantity was -6.76% while the average price change was –1.52%. So far as , Bangladesh is concerned , there was a negative change with –10.41 % in qty however the average price fell by 2.40%

       3.Comparative Analysis Of % Change In Pcs Against The % Change In Average Price Between 2013 &2015

    Country

    % Change In Qty

    % Change in Av.Price

    MEXICO

    -6.76%

    -1.52%

    BANGLADESH

    -10.41%

    -2.40%

    CHINA

    -15.59%

    2.57%

    EGYPT

    -5.44%

    15.87%

    PAKISTAN

    12.16%

    9.12%

    VIETNAM

    -12.08%

    -1.31%

    image

    Women’s Denim

    In 2013 and 2015 , China exported  118.36 & 102 million pcs respectively, however there was a  downfall of 13.82% in the export quantity in 2015 . The growth story of all other countries between 2013-15 is not so encouraging and has a very slight upward movement in terms of export quantities .The largest downfall has been registered by China  , however fall of 1.57 % in the export of Bangladesh is also not a good sign. Vietnam surprised with a growth of 7.56 % in 2015 as compared to 2013 and it is because of much awaited TTP which is expected to be signed very soon.

       4. Top Exporters Of Women’s Jeans To USA In Year 2013 & 2015 ( Pcs In Millions )

    Country

    2013

    2015

    CHINA

    118.36

    102

    BANGLADESH

    26.14

    25.73

    VIETNAM

    12.44

    13.38

    PAKISTAN

    11.45

    11.63

    CAMBODIA

    10.43

    10.52

    image

    In 2013 , Bangladesh was the least expensive with the average price of USD6.41/pc while Pakistan was the most expensive with USD8.76/pc. In 2015 , once again Bangladesh exported at the lowest average price to USA and that is only USD7.25/pc  and the Pakistan became the most expensive exporter to USA at the average price of USD8.6/pc.

      5. Average Price Of Top Exporters Of Women’s Jeans To USA In 2013 &2015 ( USD/ Pc)

    Country

    2013

    2015

    CHINA

    7.97

    7.38

    BANGLADESH

    6.41

    7.25

    VIETNAM

    8.48

    8.25

    PAKISTAN

    8.76

    8.6

    CAMBODIA

    8.2

    7.53

    image

    Analyzing the percentage change in the Quantity exported and percentage change in the average price between 2013 and 2015 , we will observe that except Vietnam ,no country has encouraging upward trend towards quantity change . China , who was the leader exporter of Women’s Jeans to USA in 2013 and 2015 , has a negative growth in qty as well as in average price. Percentage change in the quantity was -13.82% while the average price change was –7.40%. So far as , Bangladesh is concerned , there was a negative change with –1.57 % in qty however the average price took a whooping upward shift by 13.10%

       6.Comparative Analysis Of % Change In Pcs Against The % Change In Average Price Between 2013 &2015

    Country

    % Change In Qty

    % Change in Price

    CHINA

    -13.82%

    -7.40%

    BANGLADESH

    -1.57%

    13.10%

    VIETNAM

    7.56%

    -2.71%

    PAKISTAN

    1.57%

    -1.83%

    CAMBODIA

    0.86%

    -8.17%

    image

    This analysis clearly shows that , China exports more of Women’s Jeans to USA as compared to Men’s Jeans. It exported merely 36.88 million pcs of Men’s Jeans to USA in 2013 while the Women’s Jeans was 118.36 million pcs which was 220.93% more than Men’s Jeans. In 2015 , the difference in the export quantity of Men’s and Women’s Jeans was of 227.66%. Except Bangladesh , all other countries exported more of Women’s Jeans than Men’s Jeans in both 2013 and 2015.

       7. Top Exporting Countries of Men’s and Women’s Jeans To USA In 2013 ( Pcs in Millions)

    Country

    Men

    Women

    BANGLADESH

    46.09

    26.14

    CHINA

    36.88

    118.36

    PAKISTAN

    9.13

    11.45

    VIETNAM

    6.54

    12.44

    image

    8. Top Exporting Countries of Men’s and Women’s Jeans To USA In 2015 ( Pcs in Millions)

    Country

    Men

    Women

    BANGLADESH

    41.29

    25.73

    CHINA

    31.13

    102

    PAKISTAN

    10.24

    11.63

    VIETNAM

    5.75

    13.38

    image

    Looking at the % change in the average price of Men’s and Women’s Jeans between 2013 and 2015 , we observed that in 2013, the change in 2013 between the both segment exported by Bangladesh to USA was 2.72% while in 2015 the change reached to the massive level of  19.05% . China has a negative change in the average price of both segment in 2015 which is –7.40 % while the change of average price of both segment for Pakistan was less than what it had in 2013. In 2013 it had change of 26.77 % while in 2015 it reduced to 14.06 %

      9. % Change In The Average Price Of Men’s & Women’s Jeans Of Top Exporting Countries To USA Between 2013 and 2015

    Country

    2013

    2015

    BANGLADESH

    2.72%

    19.05%

    CHINA

    2.57%

    -7.40%

    PAKISTAN

    26.77%

    14.06%

    VIETNAM

    -7.22%

    -8.54%

    image