In the previous report on German market of denim jeans, we had a look at some of the important aspects of that market including its trade quantities within EU and outside with the entire world. The detailed analysis also helped to find out the consumption of jeans in German market .
We do another analysis for the UK market also . UK is again an important country in the EU with a population of over 64 million and a per capita income of about $38,000 which is less than that of Germany. UK has some large clothing retailers including M&S , Next , Tesco and many others – most of them being important players in denim industry as well. Let’s have a look at some important figures from the UK market to understand more about the denim market there including :
- Table of imports of jeans into UK from 2010 to 2014 from within EU and respective share of important countries from EU in UK market. 2 tables and 3 graphs.
- Imports of Jeans from EU27 into UK and their prices from different exporting countries.
- Table of imports of jeans into UK from 2010 to 2014 from around the world – table and graph.
- Table for % share of UK market of EU27 vs ‘Rest of the world’ with a graph.
- Table of % share of exporting countries in the market of UKÂ 2010-2014
- Table of % share of exports from and outside the EU 2010-2014
- Table for exports of jeans out of UK into EU countries 2010-2014
- Table for exports of jeans to rest of the world 2010-2014
- Net consumption of jeans in UK 2010-2014
- Per capita consumption of jeans in UK 2010 vs 2014Â
[wlm_private_special] -
EU27 COUNTRIES
Let’s begin by starting to look at figures for imports of jeans into UK from within EU. In the table below, we can see that UK imported about 7 million pcs of jeans from countries within EU – highest among them being from Spain. Other important countries are Germany, Poland, Sweden etc. However, it needs to remembered that these jeans could have been the ones that are re-distributed after importing from other countries or a part of them having been produced in EU. Its interesting to note that the total jeans imported from within EU has increased from 5 million pcs to over 7 million pcs.
Import Jeans into UK 2010-2014
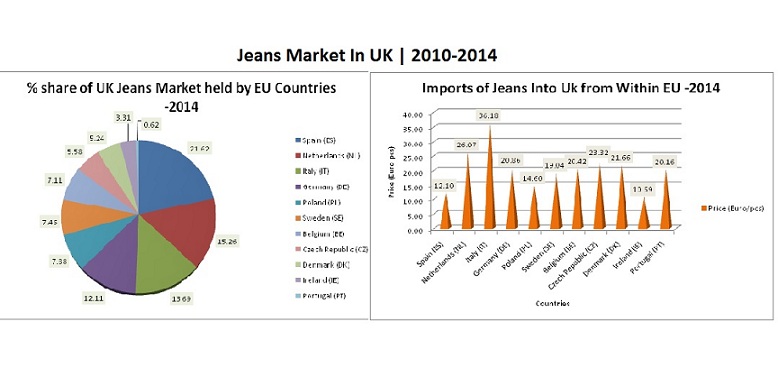
Country 2010 2011 2012 2013 2014 % of 2014 Spain (ES) 1.08 1.21 1.35 1.47 2.08 21.62% Netherlands (NL) 1.38 1.53 1.35 1.30 1.47 15.26% Italy (IT) 1.95 1.58 1.60 1.55 1.32 13.69% Germany (DE) 1.09 1.11 0.96 1.03 1.17 12.11% Poland (PL) 0.29 0.31 0.78 0.93 0.76 7.88% Sweden (SE) 0.16 0.38 0.48 0.63 0.72 7.46% Belgium (BE) 1.54 0.93 0.44 0.54 0.69 7.11% Czech Republic (CZ) 0.22 0.32 0.55 0.45 0.54 5.58% Denmark (DK) 0.28 0.36 0.47 0.38 0.51 5.24% Ireland (IE) 0.49 0.45 0.47 0.44 0.32 3.31% Portugal (PT) 0.01 0.02 0.02 0.02 0.06 0.62% Others 0.21 0.11 0.07 0.02 0.01 0.12% Total 8.69 8.31 8.57 8.74 9.64 100.00% Spain holds 29% of UK market from within EU and Germany holds about 16% and Poland about 10%.

The table below shows the average price of jeans imported into UK from EU countries. The average price of import in 2014 is Euro 25 and the prices from individual countries are given alongwith. The table and the graph below show the details of prices from important EU countries. Spain again is the most expensive .
Imports of Jeans Into UK from Within EU -2014
Country Qty (million pcs) Price (Euro/pc) Spain (ES) 2.08 12.10 Netherlands (NL) 1.47 26.07 Italy (IT) 1.32 36.18 Germany (DE) 1.17 20.86 Poland (PL) 0.76 14.60 Sweden (SE) 0.72 19.04 Belgium (BE) 0.69 20.42 Czech Republic (CZ) 0.54 23.32 Denmark (DK) 0.51 21.66 Ireland (IE) 0.32 10.69 Portugal (PT) 0.06 20.16 Others 0.01 Total 9.64 21.09 
WORLD
Without looking at the picture of imports of Jeans from around the world , we cannot have the true picture of what is happening in the UK market because most of the jeans are coming from out of EU. Bangladesh holds the largest share of 24.54% of UK market in 2014 whereas China , Pakistan and Egypt come next with 23%, 19% and 4% share. The total quantity imported in 2014 was about 86 million pcs whereas in 2010 it was about 78million pieces showing a growth of 10% in 5 years which is a decent increase.
Rest of the World | Imports of Jeans in UK 2010-2014
Country 2010 2011 2012 2013 2014 % of 2014 Bangladesh 20.07 21.05 22.06 21.74 21.24 24.54 China 29.51 24.51 22.50 18.39 19.96 23.07 Pakistan 12.19 10.63 10.94 15.05 16.61 19.19 Egypt 1.84 2.56 3.52 3.44 3.60 4.16 Cambodia 0.69 2.31 4.55 4.91 3.49 4.04 Shri Lanka 2.17 2.24 1.76 1.41 1.25 1.45 India 1.54 1.22 0.77 0.56 0.52 0.60 Morocco 0.17 0.28 0.32 0.20 0.30 0.34 Honkong 0.47 0.54 0.25 0.27 0.27 0.31 Indonesia 0.47 0.54 0.25 0.27 0.27 0.31 Tunisia 0.48 0.38 0.24 0.28 0.22 0.26 Mauritius 0.39 0.09 0.08 0.13 0.11 0.13 Sub Total 69.98 66.36 67.23 66.65 67.83 78.39 others 4.38 4.79 6.87 7.84 9.35 10.81 World 74.37 71.15 74.10 74.49 77.19 89.19 World Total 78.75 75.93 80.98 82.33 86.54 100 The graph below shows the breakup of market among the key players in 2014.

TOTAL IMPORTS
The total imports of jeans into UK can be now summed up in the table below with shipments coming from both within EU and from outside. The share of EU in the UK market is about 9% and 91% comes from rest of the world in 2014. The quantities at 86.6 million pcs is about 7% higher than that in 2010 . But it is interesting to note that the increase in shipments comes from both within EU and rest of the world. Normally one would have expected within EU shipments to have been reduced .
Imports Into UK From World and EU | 2010-2014
2010 2011 2012 2013 2014 % of 2014 World 74.37 71.15 74.10 74.49 77.19 90.8 EU 7.60 7.20 7.61 7.71 8.47 9.2 Total Import 81.97 78.35 81.71 83.20 86.66 100.00 
TOTAL CONSUMPTION
The total consumption of jeans in UK can be calculated with the table below. The first two columns show the exports of jeans to rest of the world and to EU countries. The shipments to EU countries are much higher- of course UK also has important distribution chains of many important stores . UK also has a small manufacturing setup for jeans but we have not considered it in our report. The shipments to EU27 countries increase every year and go upto 18 million pcs in 2014. When we balance the exports and imports , the net consumption comes to about 65 million pcs in 2014
Exports and Imports from And Into UK | 2010-2014 (million pcs)
Exports outside EU27 Exports to EU27 countries Total Exports Total Imports Balance consumed 2010 3.28 11.21 14.49 81.97 67.48 2011 2.26 10.47 12.73 78.35 65.62 2012 1.72 12.42 14.14 81.71 67.57 2013 2.09 14.98 17.07 82.20 65.13 2014 2.17 18.37 20.54 85.66 65.12 
PER CAPITA CONSUMPTION
The per capita consumption of jeans in UK can be calculated below:
2010
Total net consumption : 67.48 million pcs
Total population           : 62.26 million
Per capita consumption : 1.08 jeans per person/p.a
2014
Total net consumption : 65.12 million pcs
Total population           : 67.13 million
Per capita consumption : 0.97 jeans per person/p.a
From the above we can clearly see falling standards of jeans consumption in UK where per capita consumption has decreased by over 10% and even the absolute consumption has decreased . Not a great sign for the industry. But of course, some exporting countries would still be happy to have taken a larger pie of the market after having dislocated others !
[/wlm_private_special]


Leave a Reply