This is a technical article by Harry Mercer on the process of Shade control in Indigo dyeing. The first part of this article can be found here
While it cannot be disputed that, ultimately, how the individual consumer values color with their human subjectivity is the true test of coloration, in large-scale manufacturing of fabric and garments, the resort to evaluation of color visually is extremely unreliable. Color vision is 
How Color Measuring Instruments Work
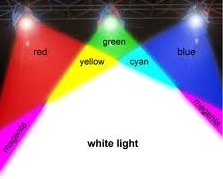
Without engaging in the complex physics and mathematics of color science and measurement, the basic principles of determining color involve a standard light source, an object to bounce the light off of and an observer (human or color measuring instrument). Color starts with light. In a color 

Color Descriptors
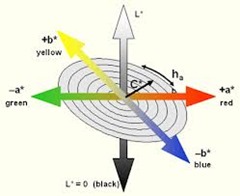
The starting point of these color spaces is the L-scale which is a vertical axis around which all colors are organized. The L-scale establishes the differences in lightness between samples-how dark or light a sample is. The L-scale starts at the top of the sphere with a value of 100, for a perfect white and ends at the bottom with 0 for a perfect black. In between are degrees of grayness. This axis is neutral with regard to color, having no color or hue, meaning without red, green, blue etc. A dark shade of Indigo may have an L-value of 30 while a light shade may have an L-value of 60. If a color difference were calculated between the dark and light values it would be a minus 30, reported as a DL -30 (delta L, or ΔL, Δ being the scientific symbol for “difference”). Starting from this neutral central axis of this sphere where are colors are mathematically located, moving outward hue is added, hue being the scientific name for color.
From the central, neutral axis, color is added gradually so that when the outer edge of the sphere is reached a saturation limit is reached at which the human eye perceives that the color is too dark to be at the same level of lightness. For example, at a lightness (L*) level of 85, which is very white, as you move outwards at first there is a small amount of red added and you have a color that would be identified as pink. If you add the maximum amount of red, then the color becomes a dark, but bright red. When the maximum amount of red has been added, more than the human eye can recognize at the L* level of 85, the lightness level will drop to 80 because the color had increased to a darker level.
If this color sphere is bisected into a series of planes that go from top to bottom of the sphere, these planes are initially divided into 4 quadrants. In the most commonly used color space (L*a*b*), there is one line labeled a* that represents red-green differences and a line labeled b* that represents yellow-blue differences. Red and green are considered to be opposing colors as are yellow and blue, just as east and west, north and south are opposites.
On the a* line a positive number like +3.5 indicates a red color and a negative number like -3.5 indicates a green. If a standard has an a* value of +3.5 and a sample has a value of +0.5, then the difference between standard and sample is expressed as Δ a*-3.0, simple subtraction. However if the standard has a value of +2.0 and the sample has a value of -1.0, then the total red-green difference is Δa*-3.0 because these are Cartesian coordinates. The total color difference is the same, but the overall visual difference is much greater because crossing the boundary between the red and green sides of color space results in much greater contrast. Red-green differences are the most significant with Indigo, not only because of the visual contrast, but also red-green differences are good predictors of wash-fastness of Indigo and even small differences in the a*values means higher variation in the laundry.
The b* line is similar for yellow-blue differences. The –b* values should be monitored as a way to evaluate changes in the original dyed color of Indigo on yarn.
The third part of the article Shade control in Indigo Dyeing follows shortly..


