“Our strong positive comp and margin expansion during the critical holiday quarter affirms our balanced growth strategy,†said Art Peck, president and chief executive officer, Gap Inc. “Our outlook for 2018 demonstrates confidence in our strategy and a meaningful step up in earnings capacity for the company.†“We are positioning the company for long term growth,†said Teri List-Stoll, executive vice president and chief financial officer, Gap Inc. “In addition to leveraging productivity initiatives to fund investments in the business, recent tax reform changes provide a meaningful increase in future earnings.â€
A. Net Sales In Fourth Quarter 2017
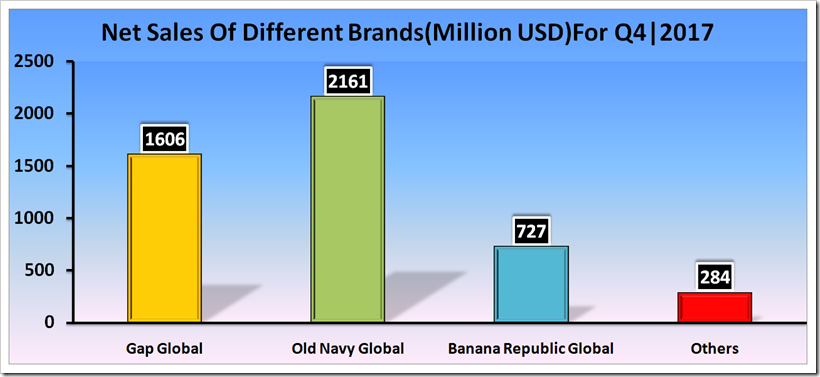
The table below shows the nets sales of different brands of Gap Inc. The net sales of Gap Global was USD 1.61 billion and the nets sales of Old Navy Global was USD 2.16 billion which was the leading brand, the least sales was of Banana Republic Global was just 0.73 billion usd, the other segments contributed 0.28 billion usd, the total sales was 4.78 billion usd for the fourth quarter of 2017.Fourth quarter fiscal year 2017 net sales increased 8 percent to $4.8 billion and fiscal year 2017 net sales were $15.9 billion.
| <span;”>Regions
(Q4 |2017) |
Gap Global
(In Million USD) |
Old Navy Global
(In Million USD) |
Banana Republic Global
(In Million USD) |
Others
(In Million USD) |
Total
(In Million USD) |
% Net Sales |
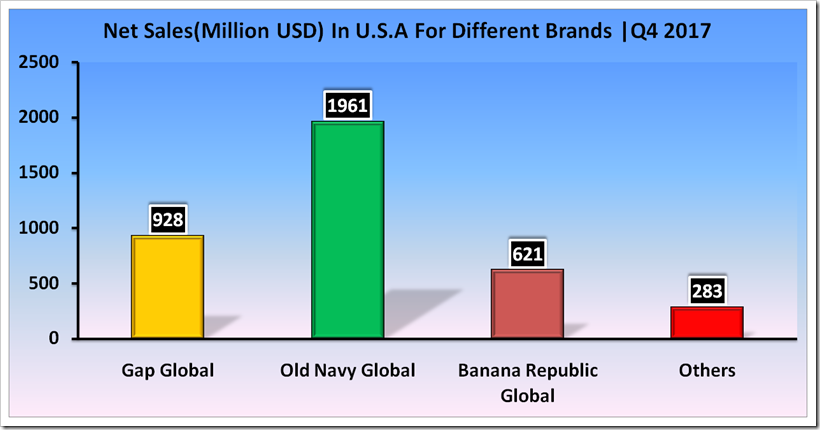
| U.S | 928 | 1,961 | 621 | 283 | 3,793 | 80 |
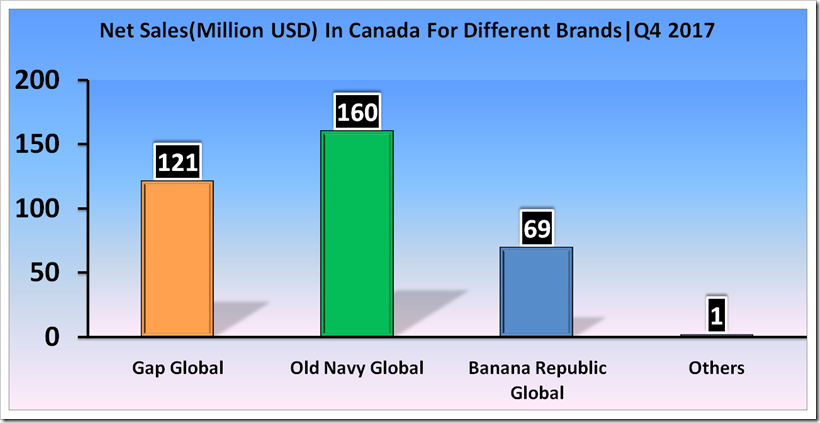
| Canada | 121 | 160 | 69 | 1 | 351 | 7 |
| Europe | 191 | 0 | 4 | 0 | 195 | 4 |
| Asia | 337 | 16 | 27 | 0 | 380 | 8 |
| Other Regions | 29 | 24 | 6 | 0 | 59 | 1 |
| Total | 1,606 | 2,161 | 727 | 284 | 4,778 | 100 |
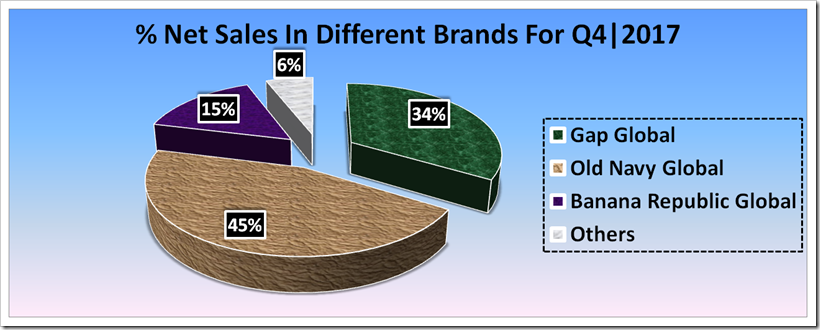
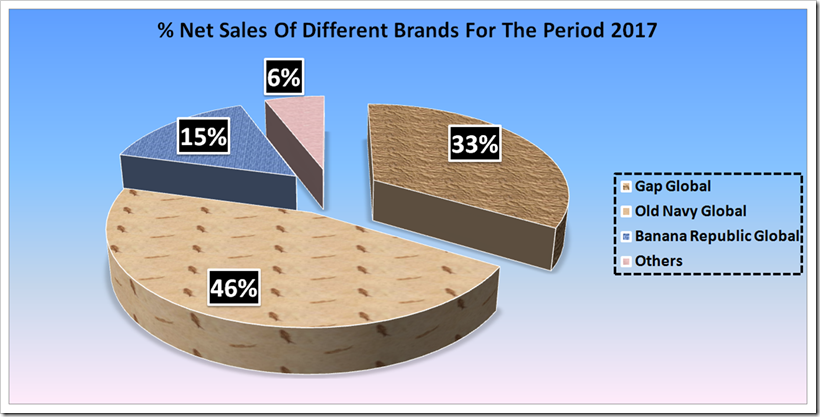
The percentage net sales contribution by different brands of Gap Global Inc, in fourth quarter of 2017 shows the significant contribution was made by Old Navy Global of about 45 % of the total sales . Similarly, Gap global and Banana Republic contributed 34 % and 15 % in total sales, the others brands contributed just 6 % in Net Sales.
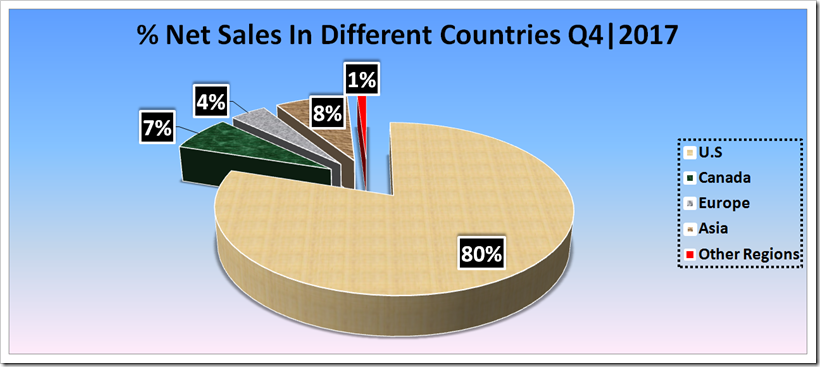
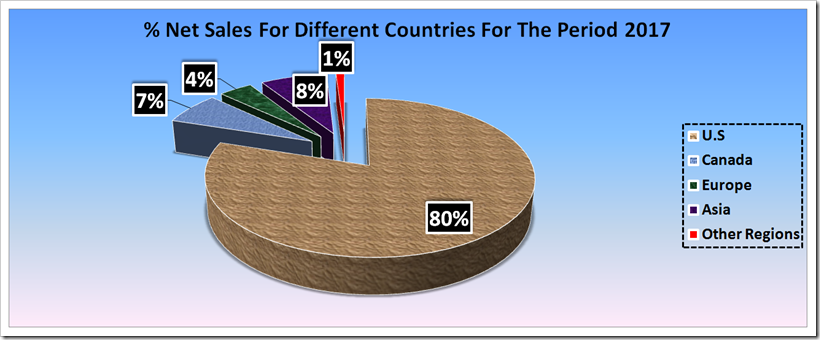
The percentage net sales in different countries for the fourth quarter of 2017 shows that out of the four countries U.S.A was leading market with 80 % in nets sales the second largest market was in Asia with 8 % whereas Canada was close to Asia with 7 % . Europe and other regions contributed 4 % and 1 % respectively. Gap has , despite efforts, not been able to make significant inroads into the European and Asian markets ,where other leading retailers like H&M , Zara etc are growing.
B. Net Sales For The Full Year 2017
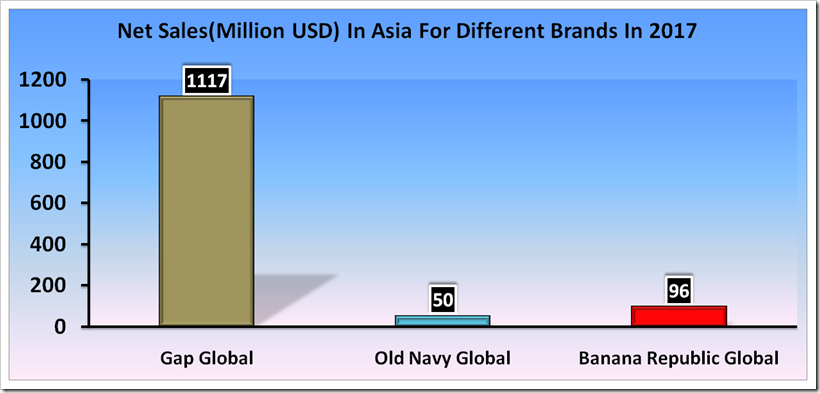
The net sales in different countries for Gap Inc for the full year 2017 again , expectedly, shows that U.S.A was largest in sales with USD 12.57 billion , the second largest sales was made in Asia with USD 1.26 billion but just 8% of sales, , similarly Canada contributed 1.17 billion usd , Europe was the least contribution in net sales with just about 4% of total sales.
| Regions
(Full Year 2017) |
Gap Global
(In Million USD) |
Old Navy Global
(In Million USD) |
Banana Republic Global
(In Million USD) |
Others
(In Million USD) |
Total
(Million USD) |
% Net Sales |
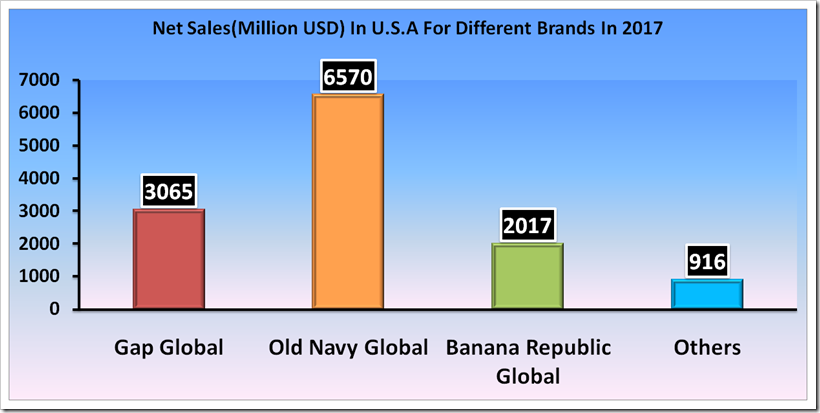
| U.S | 3,065 | 6,570 | 2,017 | 916 | 12,568 | 80 |
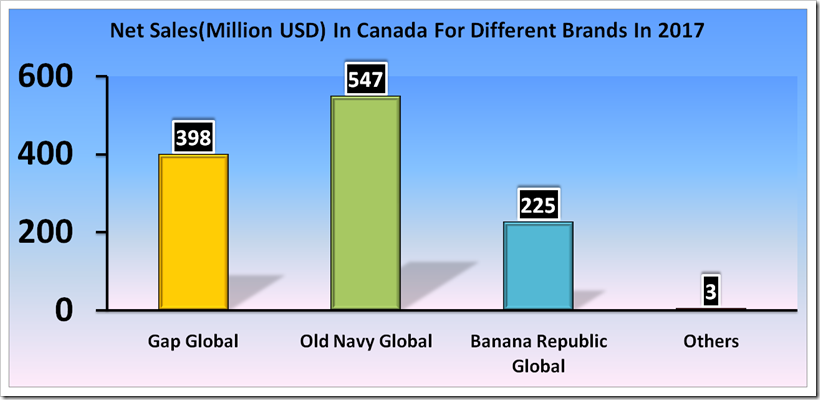
| Canada | 398 | 547 | 225 | 3 | 1,173 | 7 |
| Europe | 626 | 0 | 15 | 0 | 641 | 4 |
| Asia | 1,117 | 50 | 96 | 0 | 1,263 | 8 |
| Other Regions | 112 | 71 | 27 | 0 | 210 | 1 |
| Total | 5,318 | 7,238 | 2,380 | 919 | 15,855 | 100 |
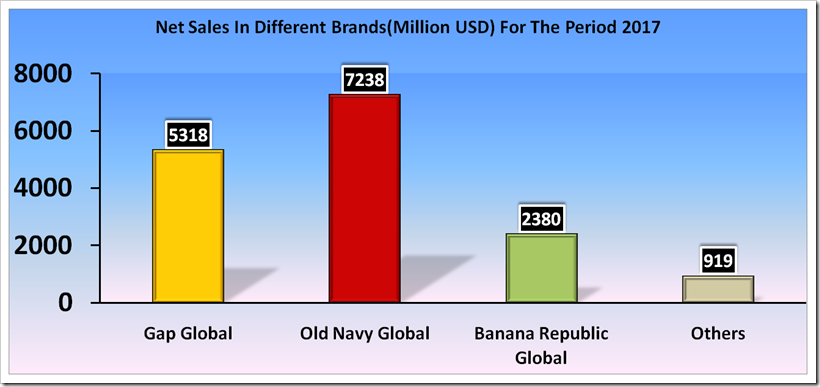
The net sales for different brands for the full year 2017 shows that the Old Navy Global contributes largest in sales with 7.24 billion usd, the second largest contribution was made by Gap Global with 5.32 billion usd similarly Banana Republic contributes 2.39 billion usd , the total sales of different brands for the full year 2017 was 15.86 billion usd .
Thus Old Navy Global contributed 46 % of the total sales followed by Gap Global at 33 %
The Net sales for the different countries for the full year 2017 again shows that U.S.A contributes the largest sales of different brands of Gap Inc, with 80% of the total sales contribution , Asia was the second largest contributor and close to it was Canada with 7 %, Europe contributed least margin in net sales .
C. Net Sales Of Different Brands
1. Gap Global
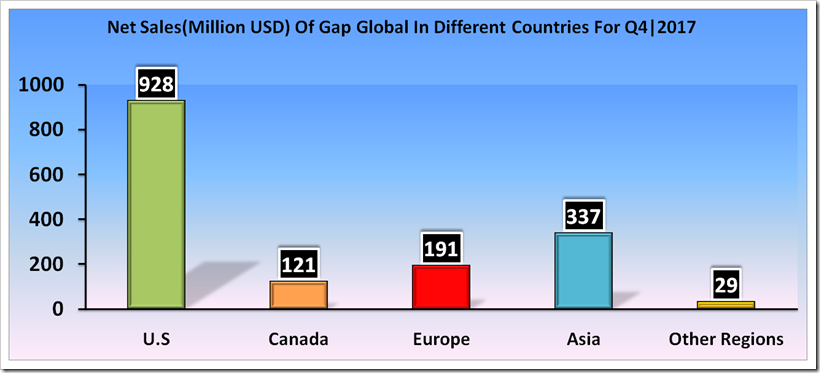
The net sales of one of the brand of Gap inc is Gap Global , the net sales of Gap global in USA shows that USA is the leading market for Gap Global with 0.93 billion usd , Asia was the second largest with 0.34 billion usd , similarly Europe contributes 0.19 billion usd and the little more is contributed by Canada with 0.12 billlion usd .
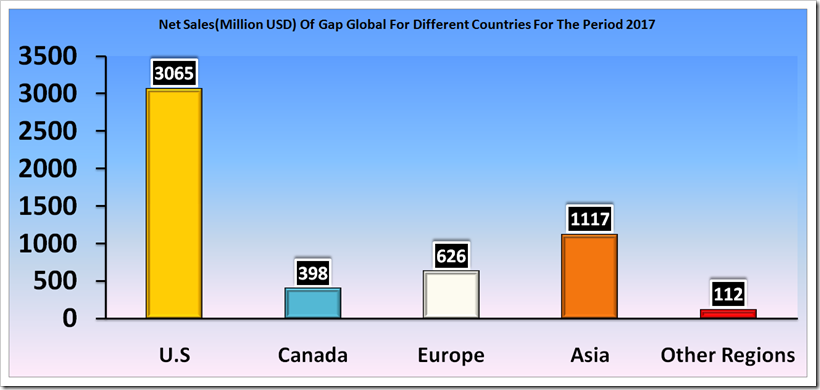
The net sales of Gap Global for different countries in 2017 shows that U.S.A contributes the largest in net sales with USD 3.07 billion followed by Asia with USD 0.11 billion . Similarly Canada and Europe contributed 0.40 billion usd and 0.63 billion usd in the net sales.
2. Old Navy
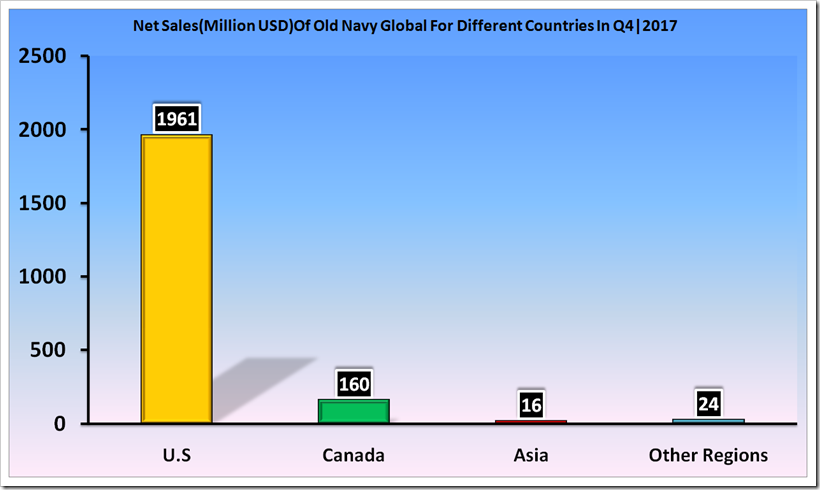
The net sales of Old Navy Global for different countries in the fourth quarter of 2017 shows that USA was the major market with USD 1.96 billion usd , Canada was the second largest market with 0.16 billion usd ,the least contribution was made by Asian regions.
3. Banana Republic
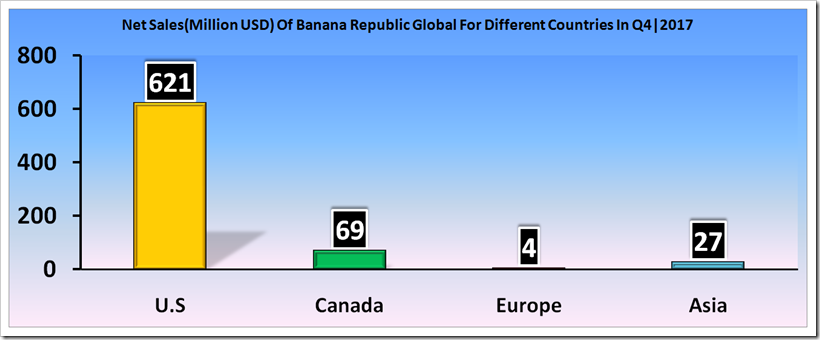
The net sales for Banana Republic Global for different countries in the fourth quarter of 2017 shows that the USA had the major market of 0.62 billion usd and the second largest market was Canada with 0.07 billion usd. Europe and Asia had considerable low contribution to the net sales for the fourth quarter 2017.
 D. Net Sales In Different Countries
1. U.S.A
In the USA regions the sales for the fourth quarter of 2017 shows that, Old Navy Global was largest brand for Gap with USD 1.96 billion of sales . Gap Global was the second and followed by Banana Republic.
2. Canada
The sales in Canada for the different brands for the fourth quarter of 2017 shows that Old Navy Global contributes the largest sales with 0.16 billion usd of sales followed closely by Gap Global and there was a relatively less contribution by Banana Republic Global.
3. Europe
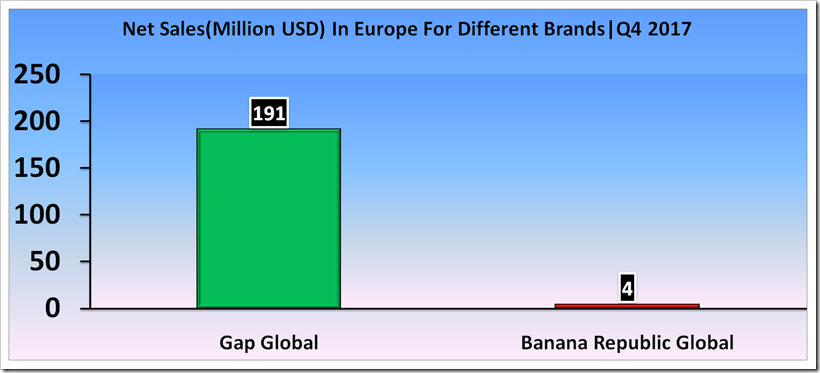
It is surprising to see that In the Europe region there were only two brands which contributed in sales for the fourth quarter : Gap Global and Banana Republic Global. Old Navy is nowhere to be seen !
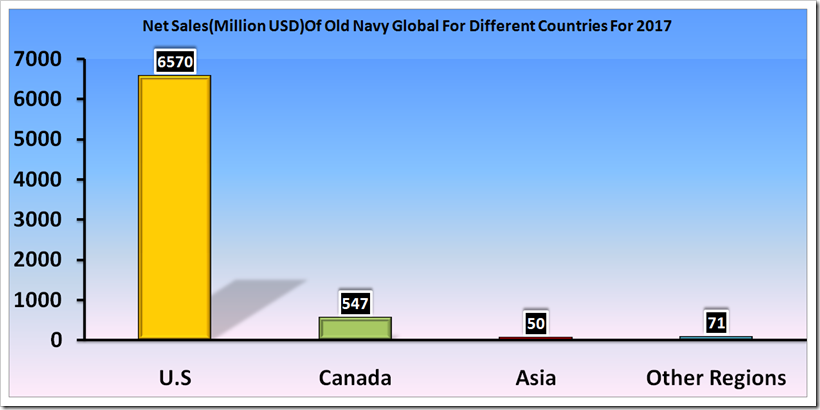
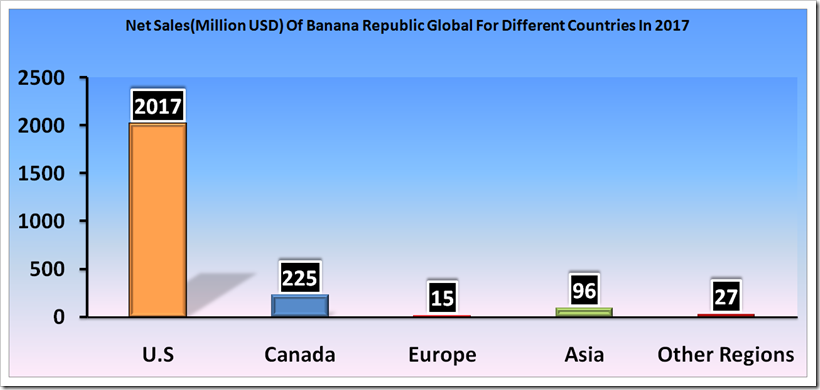
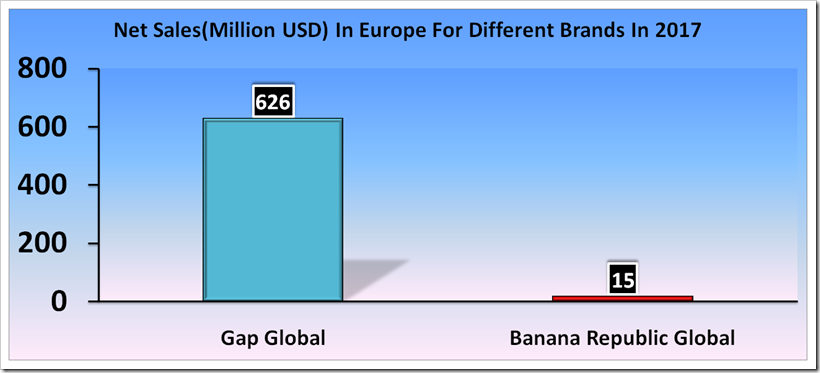
The net sales in Europe for different brands in 2017 shows that Gap Global contributes 0.626 billion usd whereas Banana Republic Global contributes 0.015 billion usd . This shows that Old Navy has actually no presence or standing in Europe.
4. Asia
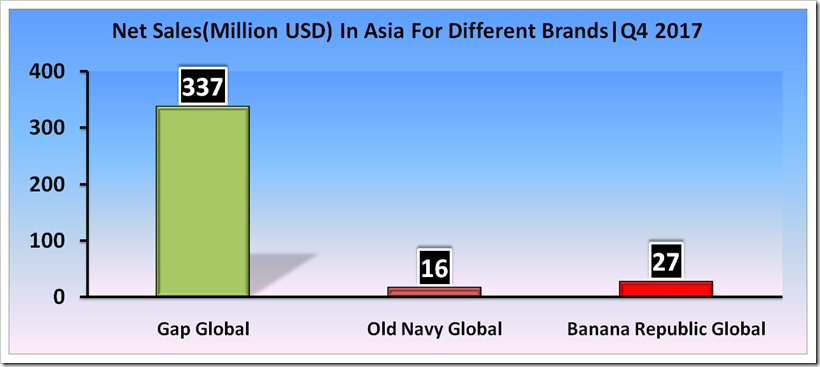
The net sales in Asia for different brands for the fourth quarter of 2017 shows that Gap Global was the largest contributor in sales followed by Banana Republic . Old Navy has a small presence which again shows that besides US market , Old Navy struggles in other regions and is not able to achieve the sales. Â
c. Stores Informations (Stores In Numbers)
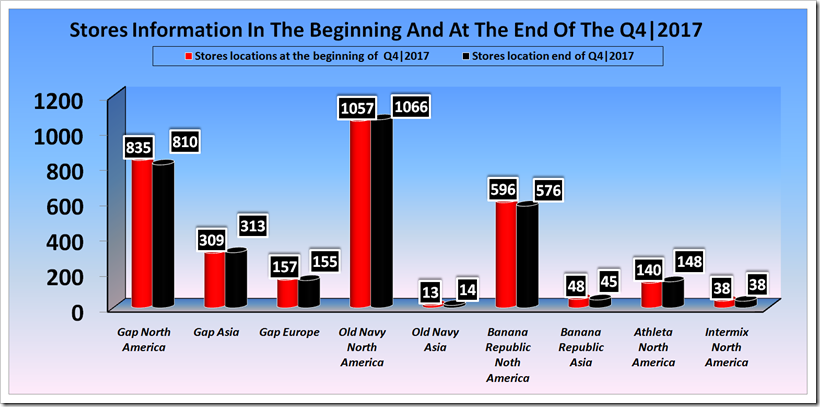
The stores information for the fourth quarter of 2017 was as follows. The stores count given below shows that for Gap Inc, North America had the most stores count of 810 stores and also largest closure of 27 stores whereas Asia had a stores count of 313 stores in fourth quarter of 2017 with most openings of 28 stores.
Old Navy had maximum concentration of stores in North America with a count of 1,066 stores count and also max openings of 12 stores. Old Navy is definitely very weak in Asia !
Banana Republic had most stores in North America with about 596 stores with major closures of 21 stores. In all , Gap closed 101 stores and opened 56 – a net closure of 45 stores !
|
Regions |
Stores locations at the beginning of Q4|2017 |
Stores location opened |
Stores location closed |
Stores location end of Q4|2017 |
|
Gap North America |
835 |
2 |
27 |
810 |
|
Gap Asia |
309 |
28 |
24 |
313 |
|
Gap Europe |
157 |
1 |
3 |
155 |
|
Old Navy North America |
1,057 |
12 |
3 |
1,066 |
|
Old Navy Asia |
13 |
1 |
0 |
14 |
|
Banana Republic North America |
596 |
1 |
21 |
576 |
|
Banana Republic Asia |
48 |
0 |
3 |
45 |
|
Athleta North America |
140 |
8 |
0 |
148 |
|
Intermix North America |
38 |
0 |
0 |
38 |
|
Company operated stores total |
3,193 |
53 |
81 |
3,165 |
|
Franchise |
446 |
3 |
20 |
429 |
|
Total |
3,639 |
56 |
101 |
3,594 |

