Category: Denim Data & Figures

  • VF Financial Results Jan-June ,2017

    VF Financial Results Jan-June ,2017

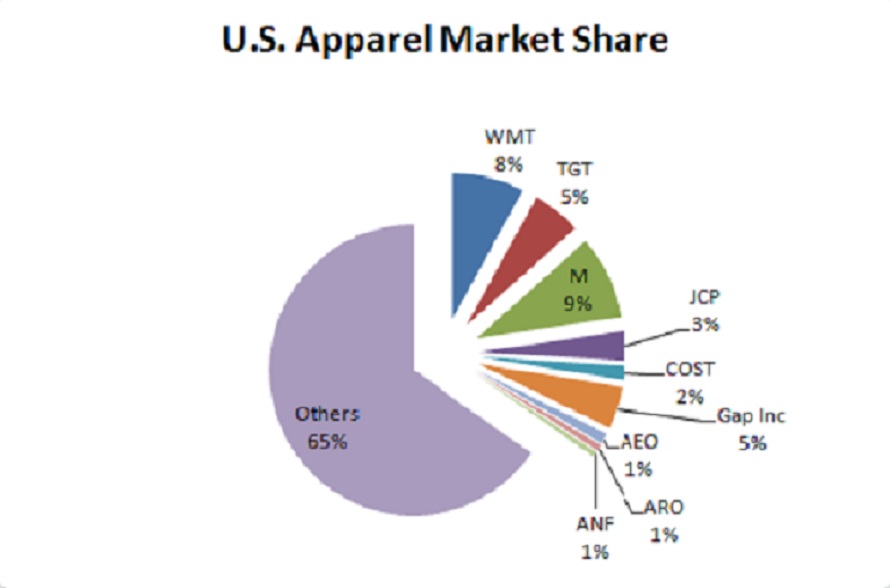
    No introduction is needed for a retailer like VF  which has about 30 well known brands in its stable and about USD 10 billion in turnover. In this article, we analyse its financials for the first 6 months of 2017 to see its performance in various segments and compare the same with its last year results. We had previously checked out their 1st quarter results as well .

     At the end of six months of the year 2017 , VF’s sales value stood at USD 4941.26 Million which is marginally lesser than the sales of 2016 for the same period . In the year 2016 , it was USD 4954.88 Million . Improvement were seen in Outdoor & Action sports and  Imagewear segments continuing the trend of 1st quarter and both increased in the range of 3%. These were the only bright spots in the , otherwise , bleak picture painted by the results. Jeanswear, once the mainstay of VF, were down a significant 6.83% and seem to be sliding down with each passing quarter. The mid priced denim brands globally are feeling the pain that VF is currently going through. Sportswear was the worst performer outpacing Jeanswear in the downtrend.  Outdoor and Action Sports is now the MAINSTAY of VF with about  64% of sales .

    Coalition revenues

    Six months ended June,2017 (In Million USD)

    Six months ended June,2016(In Million USD)

    % change

    Outdoor & Action Sports

    3145.00

    3051.84

    3.05

    Jeanswear

    1248.25

    1339.77

    -6.83

    Imagewear

    284.97

    276.64

    3.01

    Sportswear

    212.58

    233.27

    -8.87

    Other

    50.46

    53.36

    -5.43

    Total

    4941.26

    4954.88

    -0.27

    Report Showing Analysis Of Revenue and Profit Of vf For The Period Six Month Ended ,2017 And 2016Report Showing Analysis Of Revenue and Profit Of vf For The Period Six Month Ended ,2017 And 2016

    Report Showing Analysis Of Revenue and Profit Of vf For The Period Six Month Ended ,2017 And 2016

    Report Showing Analysis Of Revenue and Profit Of vf For The Period Six Month Ended ,2017 And 2016

    Report Showing Analysis Of Revenue and Profit Of vf For The Period Six Month Ended ,2017 And 2016

    Profits 

    So far as profit is concerned , VF’s earnings declined by 7% and reached to USD 613.25 Million from USD 655.91 Million . Outdoor & Action sports managed to keep its profitability with no change . The major decline has been reported in Jeanswear which is 18% . This is really significant – showing that the profits 3 times as fast as the revenue of Jeanswear fell reflecting the fact that per unit profit of jeans has fell to drastic low levels. The Sportswear profits also  fell by 7% by the end of half year in 2017 .

    Coalition profit (loss)

    Six months ended June|2017

    Six months ended June | 2016

    % change

    Outdoor & Action Sports

    352.72

    351.36

    0

    Jeanswear

    202.78

    246.14

    -18

    Imagewear

    49.97

    50.52

    -1

    Sportswear

    10.28

    11.08

    -7

    Other

    -2.49

    -3.18

    22

    Total

    613.25

    655.91

    -7

    Report Showing Analysis Of Revenue and Profit Of vf For The Period Six Month Ended ,2017 And 2016

    Report Showing Analysis Of Revenue and Profit Of vf For The Period Six Month Ended ,2017 And 2016

    In summary, VF is fighting a tough market where its only able to perform well in one segment ie Outdoor and Action Sports.  Jeanswear, for which it was once known for , has taken a nosedive and if the trend continues , VF may see serious problems coming up in some of its denim brands. The company really needs to introspect and innovate and bring up new strategies for their Jeanswear, Imagewear and Sportwear categories .


    Denim Hygge | Denimsandjeans.com

  • Report On Import Of All Denim Apparel Into EU From Mauritius For 2014 To 2016

    Report On Import Of All Denim Apparel Into EU From Mauritius For 2014 To 2016

    SN.

                                                                                         Particulars

    1.

    Table showing the imports of All Denim Apparel into EU from Mauritius for 2014 to 2016

    2.

    Graph showing the imports of All Denim Apparel into EU from Mauritius for 2014 to 2016

    3.

    Graph showing the average price of All Denim Apparel into EU from Mauritius for 2014 to 2016

    4.

    Table showing the imports of Men’s Jeans into EU from Mauritius for 2014 to 2016

    5.

    Graph showing the imports of Men’s Jeans into EU from Mauritius for 2014 to 2016

    6.

    Graph showing the average price of Men’s Jeans into EU from MAuritius for 2014 to 2016

    7.

    Table showing the imports of Women’s Jeans into EU from Mauritius for 2014 to 2016

    8.

    Graph showing the imports of Women’s Jeans into EU from Mauritius for 2014 to 2016

    9.

    Graph showing the average price of Women’s Jeans into EU from Mauritius for 2014 to 2016

    Mauritius has been an important apparel exporter for a couple of decades specially the times when the tiny country had a few denim mills including those of Arvind , Novel etc and a large number of garment manufacturers and exporters who took the advantage of duty free access to EU . However, over a period of time, as labour costs rose and as it became more difficult to meet environmental norms in the island, many of the exporters moved away or closed. However, some large ones still remain and continue to make decent quantities of apparel including jeans for the Europe and other markets. We analyse in this report on what has happened over the last 3 years in terms of jeans exports to EU from this beautiful country.

    [private_special]The imports of All Denim Apparel into EU from Mauritius , for 2014 was about million 2.45 pcs. The quantities in  2015 were almost similar at about   2.34 million pcs. However, the year 2016 saw a drop in exports to  1.91 million  pcs only. The Average price (Euro/pc ) for a pair of jeans exported in 2014 was 11.8 . However, we see that the prices rose considerably in the next two years to Euro 13.4 and 13.6 . A drop in export quantities was not surprising that the jump in prices was significant. However, it is also true that due to increasing costs, only very high value products can be made in Mauritius.

    Year of Import

    All Denim Apparel (million pcs)

    Total Value (million Euro)

    Average Price(Euro/pc)

    2014

    2.45

    28.82

    11.8

    2015

    2.34

    31.26

    13.4

    2016

    1.91

    25.95

    13.6

    Report On Import Of All Denim Apparel Into EU From Mauritius For 2014 To 2016

    Report On Import Of All Denim Apparel Into EU From Mauritius For 2014 To 2016

     Men’s Jeans

    Out of imports of All denim Apparel  from 2014 to 2016 , the imports of Men’s Jeans with million 1.73 pcs was the highest in 3 years . After 2014, we only see decline in quantities of men’s jeans exported to EU to 1.42 million pcs only in 2016.  The average price (Euro/pc) for  2014 was 11.4 . Again  if we see, the prices of men’s jeans exported also increased considerably from Euro 11.4 to Euro 13.3  – a jump of over 20% !

    Year of Import

    Men’s/Boys Jeans(million pcs)

    Total Value (million Euro)

    Average Price(Euro/ pc)

    2014

    1.73

    19.70

    11.4

    2015

    1.70

    22.38

    13.1

    2016

    1.42

    18.93

    13.3

    Report On Import Of All Denim Apparel Into EU From Mauritius For 2014 To 2016

    Report On Import Of All Denim Apparel Into EU From Mauritius For 2014 To 2016


    3.Table showing imports of Women’s Jeans

    Out of the imports of All Denim Apparel from 2014 to 2016 , the imports of women’s Jeans is comparatively lower as compared with Men’s Jeans forming about 70% and balance being women jeans. This ratio remains more or less same for the 3 years.  Women jeans imports from Mauritius showed a decline of about 30% over the three years with quantities going down from 0.72 millin pcs to 0.49 million pcs. The average price of women jeans , however, did not increase as much as that of men’s. While men’s jeans increased about 20% , women’s jeans prices increased about 13-14% in three years to Euro 14.2/pc.

    Year of Import

    Women’s/Girls Jeans (million pcs )

    Total Value (million Euro )

    Average Price (Euro/pc)

    2014

    0.72

    9.11

    12.6

    2015

    0.63

    8.88

    14.0

    2016

    0.49

    7.02

    14.2


    Report On Import Of All Denim Apparel Into EU From Mauritius For 2014 To 2016

    Report On Import Of All Denim Apparel Into EU From Mauritius For 2014 To 2016

    On the whole, we find that the exports of Jeans from Mauritius are on a way down and it seems no way that they may revive in the near future. The last companies remaining in the tiny country are fighting for survival against competition from countries like Bangladesh, Pakistan, Sri Lanka etc and it seems difficult they may make much progress ! But Mauritius will always remain a great tourism place !

    [/private_special]

  • Hugo Boss Q2 , 2017 Results

    Hugo Boss Q2 , 2017 Results

    Hugo Boss AG, often styled as BOSS, is a German luxury fashion house. It was founded in 1924 by Hugo Boss and is headquartered in Metzingen, Germany. Originally focusing on uniforms, it was a supplier for Nazi Party organizations both before and during World War II. After the war and the founder’s death in 1948, Hugo Boss started to turn its focus from uniforms to men’s suits. The company went public in 1985 and introduced a fragrance line that same year, added mens and womenswear diffusion lines in 1997, a full women’s collection in 2000 as well as children’s clothing in 2008/2009, and has since evolved into a major global fashion house. Denim is also one of the important products of Hugo Boss and hence we analyse its latest results to check out the direction in which it is moving. It is , still, primarily , a men’s label with over 85% sale in men’s segment.

    Sales Development By Segment

    In the competitive world of fashion industry with different brands into consideration ,HUGO BOSS sales value for the Q2’17 is Euro 636 Million out of which Euro 372 million accounting 59% of total sales  alone contributed by Europe Region followed by  Americas and Asia /Pacific which contributed Euro 148 million and Euro 98 million respectively . Though Europe is the biggest contributor however this region suffered a decline of 2% in its sales if we compare this quarter against the 2nd quarter of 2016 . The rest regions have performed comparatively very well specially the Asia/Pacific and License .

    Particulars

    Sales(Euro million) Q2|2017

    % Change

    Europe

    372

    -2

    Americas

    148

    5

    Asia/Pacific

    98

    11

    Licenses

    18

    27

    Total

    636

    2

    Sales Analysis Of  Hugo Boss For The  Second Quarter, 2017

    Sales Analysis Of  Hugo Boss For The  Second Quarter, 2017

    Sales Analysis Of  Hugo Boss For The  Second Quarter, 2017

     Sales Development By Channels

    Out of various channels of sales , Retail channel is leading in sales with Euro 436 million for second quarter 2017 followed by Wholesale channel which contributed Euro 182 million. The least contribution was of Licenses channel which contributed only Euro 18 million. The percentage change in retail channel was of 5%,  Similarly the license channel was of 27%. However there is a negative change in wholesale segment by –6% .

    Particulars

    Sales(Euro million) Q2|2017

    % Change

    Retail

    436

    5

    Wholesale

    182

    -6

    Licenses

    18

    27

    Total

    636

    2

    Sales Analysis Of  Hugo Boss For The  Second Quarter, 2017

    Sales Analysis Of  Hugo Boss For The  Second Quarter, 2017

    Sales Analysis Of  Hugo Boss For The  Second Quarter, 2017

    Sales By Gender

    Out of the total sales of Euro 636 million , Men’s wear is  leading in sales by Euro 568 million, whereas Women’s wear contributes Euro 68 million. The percentage change for Men’s wear is 3% and Women’s wear shows negative change by –3 %.

    Particulars

    Sales(Euro million) Q2|2017

    % Change

    Men’s wear

    568

    3

    Women’s wear

    68

    -3

    Total

    636

    2

    Sales Analysis Of  Hugo Boss For The  Second Quarter, 2017

    Sales Analysis Of  Hugo Boss For The  Second Quarter, 2017

    Sales Analysis Of  Hugo Boss For The  Second Quarter, 2017

    Showing Sales by Brands

    Boss is a leading brand in sales by Euro 545 million whereas , Hugo contributed Euro 91 million. The percentage change in sales for Boss and Hugo was 2 % and 6% respectively which signifies a better growth of HUGO against BOSS.

    Particulars

    Sales(Euro million) Q2|2017

    % Change

    BOSS

    545

    2

    HUGO

    91

    6

    Total

    636

    2

    Sales Analysis Of  Hugo Boss For The  Second Quarter, 2017

    Sales Analysis Of  Hugo Boss For The  Second Quarter, 2017

    Sales Analysis Of  Hugo Boss For The  Second Quarter, 2017

    Earning Development

    The analysis for earning development , shows that Europe is leading with Euro 106 million, followed by Americas Euro 36 million , Asia/Pacific with Euro 23 million respectively. The least earning region was  licenses with Euro 13 million only. The percentage change in earning for Europe is in negative which is –6% . Earnings have shown a fair growth in Americas , Asia/ Pacific , licenses and it was 6%, 30%, 14% respectively.

    The biggest gainer is Asia Pacific region with a growth rate of 30% and the total earning for the same is Euro 23 million . The Asia Pacific region has become new attraction point for every international retailer and specifically India .

    Particulars

    Earning development (Euro million) Q2|2017

    % Change

    Europe

    106

    -6

    Americas

    36

    6

    Asisa/Pacific

    23

    30

    Licenses

    13

    14


    Sales Analysis Of  Hugo Boss For The  Second Quarter, 2017

    Sales Analysis Of  Hugo Boss For The  Second Quarter, 2017

    Asia Pacific shows the most growth in the charts of Hugo Boss . The region includes countries like China, India and others, An annual report by AT Kearney detailing emerging retail markets recently put India at the top of the list, beating out China for the first time. India’s expanding economy, booming consumption rates and growing middle class all make it an especially attractive prospect for retailers, the report explained. As retailers struggle in the U.S.and UK , a new report suggests India could be the next bright spot for the industry A.T. Kearney’s annual look   here .

    Sales Analysis Of  Hugo Boss For The  Second Quarter, 2017

     Stores Information

    Out of 442 stores at the beginning of Dec 31, 2016 , openings and takeovers were 10 and the number of closures were 14 . At the end of June , The total number stores stood at 438 .

    Particulars

    No of Stores

    Stores at December 31, 2016

    442

    Openings & takeovers

    10

    closings

    -14

    Stores at June 30,2017

    438

    Sales Analysis Of  Hugo Boss For The  Second Quarter, 2017


    The first Edition Of Denimsandjeans India show is scheduled on Sept 25-26 at Hotel Lalit Ashok , Bangalore . To know more about Indian Apparel Market , Please follow below links :

    To visit the show , please register here

    Denimsandjeans India | September 25-26

  • VF Financial Results Q1 , 2017

    VF Financial Results Q1 , 2017

    VF Corporation, with well known brands in its stable like The North Face®, Vans®, Timberland®, Wrangler®, Lee® and Nautica® , is a global leader in the design, manufacture, marketing and distribution of branded lifestyle apparel, footwear and accessories. The company’s highly diversified portfolio of 30 powerful brands spans numerous geographies, product categories, consumer demographics and sales channels. Denim and Jeanswear is one of the key segments where VF brands have a powerful presence. A study of VF’s financials gives an idea of the direction company is taking and some idea on how consumers are reacting to various segment offerings.

    In this report we have done the detailed analysis as well as comparative analysis for 1st quarter of 2017  and a comparative analysis for the same period of last year.

    Segment

    Q1| 2017 ( Million $ )

    Q1| 2016 ( Million $ )

    %

      Outdoor & Action Sports

      1678.8

      1639.1

      2

           Jeanswear

      647.4

      710.6

      -9

          Imagewear

      135.0

      141.8

      -5

         Sportswear

      98.3

      118.4

      -17

          Other

      22.1

      24.5

      -10

        TOTAL

      2581.7

      2634.4

      -2

    In the 1st Quarter of  2017, VF Corporation’s total revenue is  $2581.7 million, out of which outdoor & Action Sports  was $1678.8 million which  is 65 %(approx)  share of total revenue. The sales in Jeanswear has fallen  by 9% while Imagewear fell  about 5% which is not a normal reduction and shows significant loss of market.  There  is a huge fall of 17 % in Sportswear sales compared to last year  and  the other segment also saw a fall of 2 %.  On analysis we can  find that Outdoor & Action Sports is  the current flavor of the consumers and VF, like many other brands, are trying to are struggling to sustain their denim and sportswear sales.

    Report Showing the Detailed and Comparative Analysis for First Quarter 2017

    Report Showing the Detailed and Comparative Analysis for First Quarter 2017

    Report Showing the Detailed and Comparative Analysis for First Quarter 2017

    Report Showing the Detailed and Comparative Analysis for First Quarter 2017

    If we look at the profit sharing of different segments ,there is marginal increase in the Outdoor & Action Sports by 1 % from the Q1 of last year ,however the Jeanswear segment reduced substantially by 14%  which shows that the actual realisations per unit of jeanswear is lower than last year . There is a fall of 7 percent in the share of total revenue of Imagewear segment. . The Sportswear segment is now a loss making proposition for VF and the company has not made any money on Sportswear sales.

    PARTICULARS

    Q1|2017

    Q1|2016

    %

    Outdoor & Action Sports

    230.94

    228.11

    1

    Jeanswear

    118.11

    137.29

    -14

    Imagewear

    24.40

    26.14

    -7

    Sportswear

    -1.07

    4.78

    -122

    Other

    -2.20

    -2.61

    -16

    TOTAL

    370.10

    393.71

    -6


    Report Showing the Detailed and Comparative Analysis for First Quarter 2017

    Report Showing the Detailed and Comparative Analysis for First Quarter 2017

    Report Showing the Detailed and Comparative Analysis for First Quarter 2017

         Particulars

       % Revenue

    % Profit

        Outdoor & Action Sports

                2%

          1%

        Jeanswear

              -9%

        -14%

         Imagewear

               -5%

         -7%

         Sportswear

               -17%

        -122%

        Other

               -2%

        -16%

    Report Showing the Detailed and Comparative Analysis for First Quarter 2017

    To summarise , Outdoor and Action Sports is the only segment working for VF right now and it seems to find itself in a spot in most other segments. It needs to pull up its socks to keep up in the tough business conditions !

  • Munich Fabric Brings 100 Companies In Blue Zone | Jan 31- Feb 1

    Munich Fabric Brings 100 Companies In Blue Zone | Jan 31- Feb 1

    Munich Fabric Start, which begins from today has a total  of 800 fabrics and 280 additional suppliers from over 37 countries  presenting their collections. The exhibitors will also showcase a series of dynamic, innovative and sustainable solutions and processes and innovations affecting not just silhouettes, materials and colors, but also structures of the entire market.

    Munich Fabric Start | Denimsandjeans.com

    With over 100 brands the two halls of the BLUEZONE are once again fully booked. With 75 established denim mills in Hall 7 the ALL STAR MILLS alone presents an international premium portfolio and current developments, finishes and washes for denim & sportswear. New names here include: ALBIATE 1830, KURABO, DENIM STUDIO, BLU INTERNATIONAL, CRESENT, REDMARK, FIREMOUNT and SOORTY. At CATALYZER in Hall 6, 25 suppliers will be providing information on innovations with a focus on denim heritage and blueprints as well as sustainability.

    Let’s Detox Denim – Mission Blue by bluesign technologies AG and G-Star Raw show a commitment for a healthy, save and environmentally-friendly production process. G-Star plays a leading role in the detox of denim by using bluesign® systems to maintain this philosophy. bluesign® systems is based on a holistic approach with input stream management for a reduced use of chemicals and a maximum protection of people and environment.

    Munich Fabric Start | Denimsandjeans.com

    KEYHOUSE – THE INNOVATIVE THINK TANK

    ‘Fashion goes Technology’ is the heading for KEYHOUSE in Hall 5. Here over 40 suppliers will be showcasing their latest technology and sustainability developments that can be integrated into textile products and high fashion. The wide-ranging and individual portfolio reflects the future of the sector which is increasingly exploring the topic of sustainable and forward-looking textiles and processes. Names here include: Schoeller, Toyota, Panteratex, Grantec, Cordura, Lenzing, Filatures du Parc, Naveena sowie Dyneema and Ecoalf.

    The significance of this comprehensive theme revolutionising the fashion and textiles market is also demonstrated by the renewed presence of SOURCEBOOK at KEYHOUSE. A cooperation between leading European companies in the textiles and technology sectors, this offers an insight into the influential and defining development processes of the future. The notable pioneers in this R&D sector focusing on Fashion Tech, Wearable Tech and Smart Materials include: TheLab by Elektrocouture, Strick Zella, ITA by RWTH Aachen, Forster Rohner Textile Innovation as well as Trotec.

    Munich Fabric Start | Denimsandjeans.com

    SUSTAINABLE INNOVATIONS FORUM

    Under the heading “Sustainable Innovations” MUNICH FABRIC START is bringing ideas from the distant future into the Here and Now. In collaboration with the sustainability expert Nina Marenzi from the platform The Sustainable Angle, Kern Kommunikation – experts in innovation and sustainability and long-standing cooperation partner of the trade fair – has identified selected, outstanding innovative approaches that will be showcased on 31 January and 1 February 2017 at a special presentation area at KEYHOUSE.

    From fruit leather and non-woven wool through to fibres made from citrus fruit – the forward-looking concepts selected by Marenzi and Kern Kommunikation for “Sustainable Innovations” provide a progressive and new twist on familiar materials and processes as well as their transformation in an age of thoughtfulness.

    Munich Fabric Start | Denimsandjeans.com

    HIGHTEX AWARD

    With a specially initiated HIGHTEX AWARD, the innovation prize awarded for the first time at the last event, it has been possible to create a forum that increasingly takes the high demand for innovation, added value and unique selling points on the textile and fashion market into consideration. The presentation of the specially created award, designed by VOJD STUDIOS Berlin in 3D technology, is a recognition of the achievements in these areas, allowing designers and product managers additional creative potential in collection design. The HIGHTEX AWARD winners will be presented on 31 January 2017 at 2.00pm at KEYHOUSE.

    LI EDELKOORT – EXCLUSIVE TREND PRESENTATION

    The highlight of the events programme is an exclusive lecture by the renowned trend expert Li Edelkoort presenting her interpretations on the topic of TRANSITION for Spring Summer 18 at MUNICH FABRIC START and providing initial insights into the season Autumn Winter 18/19. Furthermore, numerous expert workshops, panel discussions and trend seminars on seasonal themes and technology, finishing and research will also be on the agenda.

    Munich Fabric Start | Denimsandjeans.com


    The continuously increasing importance of denim in the apparel industry in Vietnam brings out another edition of Denimsandjeans shows at HCMC in June 2017. With the first Denim Show in Vietnam launched by the Denimsandjeans.com, the second edition in June 2017 brings some of the leading denim jeans and fabric companies besides chemical, accessory and other suppliers in the denim supply chain.

    For Invitation , please register here.

    Street Style | Denimsandjeans Vietnam

  • Exports Of Denim Fabric By Mexico | 2015-2016

    Exports Of Denim Fabric By Mexico | 2015-2016

    Serial No Particulars

    1

    Table Showing Export Of Denim Fabric ( Million Sq Mtr) By Mexico For YTD June 2016

    2

    Graph Showing Export Of Denim Fabric ( Million Sq Mtr) By Mexico For YTD June 2016

    3

    Pie Chart Showing % Share In The Export Of Denim Fabric Made By Mexico For YTD June 2016

    4

    Table showing Average Price of Export Of Denim Fabric Made By Mexico For YTD June 2016

    5

    Graph Showing Average Price of Export Of Denim Fabric Made By Mexico For YTD June 2016

    6

    Table Showing Export Of Denim Fabric ( Million Sq Mtr) By Mexico In 2015

    7

    Graph Showing Export Of Denim Fabric ( Million Sq Mtr) By Mexico In 2015

    8

    Pie Chart Showing % Share In The Export Of Denim Fabric Made By Mexico In 2015

    9

    Table showing Average Price of Export Of Denim Fabric Made By Mexico In 2015

    10

    Graph showing Average Price of Export Of Denim Fabric Made By Mexico In 2015


    Mexico’s economy has performed well relative to other major Latin American economies in recent years, largely because of its thriving manufacturing sector. Unlike Brazil and Argentina, whose manufacturing sectors are slumping, Mexico has continued to see solid growth because of its integration with and dependence on the U.S. market. Although low global oil prices will put pressure on Mexico’s economy, the performance of the manufacturing sector — especially in high-end manufacturing — will be a key driver of Mexico’s economic growth this year and beyond.

    Analysis:

    In the late 1980s and early 1990s, Mexico underwent a profound economic and political reorganization. The economy liberalized, culminating in the North American Free Trade Agreement. Major state-owned companies privatized, transforming Mexico from a closed economic and political system into an export-oriented industrial economy. As a result, trade increased between Mexico and the United States, and a manufacturing belt sprung up at the countries’ shared border. From 1990 to 2000, Mexican trade became even more closely tied to the United States. In 1990, the United States accounted for 69 percent of all Mexican trade; by 2000, it accounted for nearly 80 percent.

    But at the turn of the century, China’s special economic zones became cost-competitive alternatives to Mexican factories. Mexico responded by making more valuable products, such as automotive, aeronautical and electronic products. Thus, even though clothing exports dropped 43 percent (from $7.6 billion to $4.3 billion) between 2002 and 2012, automotive exports increased by 152 percent ($27.9 billion to $70.3 billion) and electronic exports increased by 73 percent ($43.3 billion to $74.9 billion) over the same period. Asian alternatives to high-end products notwithstanding, these Mexican products remained cost-competitive because of NAFTA.

    Moreover, rising wages in China have once again shifted the equation in global manufacturing. Average manufacturing labor costs in Mexico are now almost 20 percent lower than in China, whereas in 2000, Mexico’s labor costs were 58 percent more expensive than China’s. All these reasons again make it comeback story for Mexico and we see a resurgence of exports to US including apparel. In this report we did a detailed analysis of Export of Denim Fabric By Mexico For the year 2015 and YTD June 2016 . We will see how Mexico how and where is Mexico exporting its denim fabrics and at what prices. Normally it is believed that US should be the largest market for Mexican denim fabrics. Is it so ? Maybe not !

    Denim-Mashup Mail2---

    [private_special]

    Export Of Denim Fabric ( Million Sq Mtr) By Mexico For YTD Jan-June 2016

    S.No

    Country

    Sq Mtr ( Million)

    1

    Nicaragua 

    7.363

    2

    U.S.A

    5.259

    3

    Colombia 

    0.753

    4

    Dominican Republic

    2.285

    5

    Peru

    0.201

    6

    Turkey

    0.462

    7

    Bolivia 

    0.101

    8

    Poland

    0.481

    9

    South Africa

    0.038

    10

    Egypt

    0.084

    Mexico has exported approx. 17.775 million square mtr of total denim fabric for YTD June 2016 out of which 7.363 million square mtr and 5.259 million square mtr of denim fabric exported to Nicaragua and United States Of America respectively . The third highest exporting destination for Mexico is Dominicana with 2.285 million square mtr.


    Export Of Denim Fabric By Mexico | June 2016

    Export Of Denim Fabric By Mexico | June 2016


    Average Price of Export Of Denim Fabric Made By Mexico For YTD Jan-June 2016

    S.No

    Country

    Av Price per sq mtr

    1

    Nicaragua 

    1.85

    2

    U.S.A

    1.97

    3

    Colombia 

    2.14

    4

    Dominican Republic

    2.14

    5

    Peru 

    2.21

    6

    Turkey

    2.40

    7

    Bolivia 

    2.49

    8

    Poland

    2.48

    9

    South Africa

    2.30

    10

    Egypt

    2.29

    Nicaragua is the least expensive exporting destination and the average price at which the exports are made is USD 1.85/ Sq Mtr . USA is second with the average price of USD 1.97/Sq Mtr. Bolivia is the most expensive country with the average price of USD 2.49/Sq Mtr.

    Export Of Denim Fabric By Mexico | June 2016


    Export Of Denim Fabric ( Million Sq Mtr) By Mexico In 2015

    S.No

    Country

    Sq Mtr ( Million)

    1

    Nicaragua 

    16.416

    2

    U.S.A

    8.558

    3

    Colombia

    2.972

    4

    Dominican Republic

    4.031

    5

    Peru 

    0.883

    6

    Turkey

    0.146

    7

    Bolivia 

    0.528

    8

    Poland

    0.995

    9

    South Africa

    0.609

    10

    Egypt

    1.370

    Mexico has exported approx. 40.48 million square mtr of total denim fabric in 2015 out of which 16.416 million square mtr and 8.558 million square mtr of denim fabric exported to Nicaragua and United States Of America respectively . The third highest exporting destination for Mexico is Dominicana with 4.031 million square mtr.

    Export Of Denim Fabric By Mexico | June 2016

    Export Of Denim Fabric By Mexico | June 2016


    Average Price of Export Of Denim Fabric Made By Mexico In 2015

    S.No

    Country

    Avg Price

    1

    Nicaragua

    1.77

    2

    U.S.A

    2.27

    3

    Colombia 

    2.10

    4

      Dominican Republic

    2.09

    5

    Peru 

    2.40

    6

    Turkey

    2.81

    7

    Bolivia

    2.58

    8

    Poland

    2.41

    9

    South Africa

    2.11

    10

    Egypt

    2.27

    Nicaragua is the least expensive exporting destination and the average price at which the exports are made is USD 1.77/ Sq Mtr . Dominicana is the second least expensive with the average price of USD 2.27/Sq Mtr. Turquia is the most expensive country with the average price of USD 2.81/Sq Mtr.

    Export Of Denim Fabric By Mexico | June 2016


    [/private_special]

  • Imports Of Denim Fabrics For Consumptions By USA| Year-To-Date from Jan–May,2015-16

    Imports Of Denim Fabrics For Consumptions By USA| Year-To-Date from Jan–May,2015-16

    Serial No.

    Particulars

    1

    Table Showing Comparative Figures Of Imports Of Denim Fabrics For Consumptions By USA For January to May 2015 &2016 ( In Million Sq Mtrs)

    2

    Graph Showing Comparative Figures Of Imports Of Denim Fabrics For Consumptions By USA For January to May 2015 &2016 .

    3

    Table Showing Comparative Average Price Of Imports Of Denim Fabrics For Consumptions By USA For January to May 2015 &2016 ( USD/Sq Mtr)

    4

    Graph Showing Comparative Average Price Of Imports Of Denim Fabrics For Consumptions By USA For January to May 2015 &2016

    5

    Table Showing Imports Of Denim Fabrics For Consumptions By USA From 2012-2015 and  its % share in 2015 . ( In Million Sq Mtrs)

    6

    Graph Showing Imports Of Denim Fabrics For Consumptions By USA From 2012-2015 and  its % share in 2015 . ( In Million Sq Mtrs)

    7

    Pie Chart showing % share of countries in the imports of Denim Fabrics For Consumption By USA in 2015.

    8

    Table Showing Average Price Of  Imports Of Denim Fabrics For Consumptions By USA From 2012-2015 .( USD/Sq Mtrs)

    9

    Line Graph Showing Average Price Of  Imports Of Denim Fabrics For Consumptions By USA From 2012-2015 .

    10

    Table Showing Imports Of Denim Fabrics For Consumptions By USA From 2012-2016 ( Jan To May 2016) ( In Million Linear Mtrs)

    11

    Graph Showing Imports Of Denim Fabrics For Consumptions By USA From 2012-2016 ( Jan To May 2016)

    12

    Table Showing Av Price Of Imports Of Denim Fabrics For Consumptions By USA From 2012-2016 ( Jan To May 2016)( USD/Linear Mtrs)

    13

    Graph Showing Av Price Of Imports Of Denim Fabrics For Consumptions By USA From 2012-2016 ( Jan To May 2016)

    In our previous report, We did an analysis of the major denim apparel exporting countries to USA for Jan-May 2016 . In this report , we have done a detailed analysis of the major denim fabrics exporting countries to USA for Jan-May 2016.

    In the year 2015 ( Jan-May) , China exported 4.33 million square meters of denim fabrics to USA and achieved a growth of 10.60% for the same period in 2016 and the export quantity was 4.79 million square meters. However, the eye catching figure is of Mexico , which grew by 43.30% in Jan-May 2016 compared to Jan-May 2015 . In 2015 , it exported 2.57 million square meters while in the next year for the same period , it exported 3.69 million square meters. Other countries like Japan showed a downfall of -4.60 % however Turkey shown a positive growth of 1.40% in Jan-May 2016.

      US Imports For Consumption Of Fabrics For YTD 2015-16 (table) 

    [private_special]

    Country

    2015 YTD

    2016 YTD

    % Change
    YTD2015 – YTD2016

    China

    4.33

    4.79

    10.60%

    Mexico

    2.57

    3.69

    43.30%

    Japan

    1.57

    1.50

    -4.60%

    Turkey

    0.87

    0.88

    1.40%

    Taiwan

    1.02

    0.63

    -38.60%

    India

    0.80

    0.59

    -25.50%

    Italy

    0.85

    0.36

    -57.70%

    image

    Looking at the average price of Imports to USA, we find India the least expensive which  exported the fabrics at the average price of USD 1.22/ Sq Mtr & USD 1.20/Sq Mtr In Jan-May 2015 and 2016 respectively. Japan is the most expensive amongst all the countries and it exported the fabric at the average price of USD 6.92/Sq Mtr & USD 6.31/Sq Mtr for 2015 and 2015 respectively. After comparing the average price for the both period , we can draw this conclusion that average price for all the countries fell down in Jan-May 2016 and Italy is the biggest looser amongst all.

      Average Price Of US Imports For Consumption Of Fabrics For Jan – May 2015-16

    Country

    Jan- May 2015
    (USD/ Sq mtr)

    Jan- May 2016
    (USD/ Sq mtr)

    % Change | YTD 2015-2016

    China

    2.18

    2.08

    -4.53%

    Mexico

    2.05

    1.87

    -8.73%

    Japan

    6.92

    6.31

    -8.78%

    Turkey

    5.49

    5.14

    -6.32%

    Taiwan

    2.13

    2.13

    0.13%

    India

    1.22

    1.20

    -1.45%

    Italy

    4.97

    4.56

    -8.25%

    image

    Further to the figures of 2016 , it would also be very pertinent to see what happened in the last three years and how the different countries have been performing  in relation to their denim fabric exports to US. China has been the exporting the highest quantity of fabric to US for last several years , though Mexico has been growing more rapidly than China . Still china managed to keep it position at the top . However in the year 2013 and 2014 , China has shown a downfall in the export quantities. In the year 2015 China exported 10.476 million square meters of denim fabric at the average price of USD 2.17/Sq Mtr accounted 38.88% share in the total export made to US by top exporting countries. Mexico exported 6.315 million sq mtr of denim fabrics to US in 2015 at the average price of USD 2.11/Sq Mtr accounted 23.44% share in the total export. India is the least expensive exporter at $1.26/ sq mtr of fabric over the years and Japan is the most expensive one at $6.75/sq mtr.

       U.S. Imports for Consumption Of Fabrics 2012-2015

    In Million Sq Mtrs

    Country

    2012

    2013

    2014

    2015

    % Share In 2015

    China

    12.41

    11.833

    8.631

    10.476

    38.88%

    Mexico

    6.676

    5.538

    4.09

    6.315

    23.44%

    Japan

    2.072

    3.052

    3.564

    3.395

    12.60%

    Turkey

    1.724

    2.048

    1.438

    1.979

    7.34%

    Taiwan

    3.195

    2.624

    2.12

    1.731

    6.42%

    India

    0.735

    0.747

    0.389

    1.643

    6.10%

    Italy

    2.717

    2.219

    2.371

    1.407

    5.22%

    image

    image

      Average Price Of  Imports Of Denim Fabric 2012-2015

    (USD/Sq Mtrs)

    Country

    2012

    2013

    2014

    2015

    China

    2.07

    2.29

    2.29

    2.17

    Mexico

    2.28

    2.13

    2.14

    2.11

    Japan

    7.03

    6.76

    6.67

    6.75

    Turkey

    6.14

    5.80

    6.01

    5.42

    Taiwan

    2.13

    2.14

    2.12

    2.11

    India

    1.39

    1.34

    1.26

    1.27

    Italy

    5.29

    5.15

    5.14

    4.96

    image


    The below analysis has been done in Linear Mtrs while the above have done in Sq Mtrs.

    Imports Of Denim Fabrics In USA From 2012-2016

    (Million Linear  Mtrs assuming standard width of 1.5mtr)

    Country

    2012

    2013

    2014

    2015

    2015 YTD

    2016 YTD

    China

    8.27

    7.89

    5.75

    6.98

    2.88

    3.19

    Mexico

    4.45

    3.69

    2.73

    4.21

    1.72

    2.46

    Japan

    1.38

    2.03

    2.38

    2.26

    1.05

    1.00

    Turkey

    1.15

    1.37

    0.96

    1.32

    0.58

    0.59

    Taiwan

    2.13

    1.75

    1.41

    1.15

    0.68

    0.42

    India

    0.49

    0.50

    0.26

    1.10

    0.53

    0.40

    Italy

    1.81

    1.48

    1.58

    0.94

    0.56

    0.24

    image

    Average Price Of Imports Of Denim Fabrics In  USA From 2012-2016

    (USD/Million Linear  Mtrs)

    Country

    2012

    2013

    2014

    2015

    2015 YTD

    2016 YTD

    China

    3.10

    3.44

    3.43

    3.25

    3.27

    3.12

    Mexico

    3.42

    3.20

    3.21

    3.16

    3.08

    2.81

    Japan

    10.54

    10.14

    10.00

    10.12

    10.38

    9.47

    Turkey

    9.20

    8.70

    9.02

    8.14

    8.24

    7.71

    Taiwan

    3.19

    3.21

    3.18

    3.16

    3.19

    3.19

    India

    2.08

    2.02

    1.90

    1.90

    1.83

    1.80

    Italy

    7.94

    7.72

    7.71

    7.45

    7.46

    6.84

    image

    If we look at the total figures of denim fabric imports into US in the last four years , we will find that the fabric imports reduced from 30 million sq. mtrs in 2012 to 23 million sq mtrs in 2014. However, there has been a revival in 2015 to 27 million sq mtrs. Also in 2016 the first five months show an improvement of about 3% in import quantities. This augurs well for the market and is also indicative that more activity is taking place in this market whether it is for re-export of fabrics or for local consumption. However, what is heartening to see is that Mexico is performing well on this count and is exporting its own fabrics to US in an increasing way.

    2012 – 30 million mtr approx.

    2013- 28 million mtrs approx.

    2014 – 23 million mtrs approx.

    2015- 27 million mtrs approx .

    [/private_special]

  • Gap Results Are Negative , Again ! | First Quarter 1 2016 Comparable Sales Results

    Gap Results Are Negative , Again ! | First Quarter 1 2016 Comparable Sales Results

    Gap Inc.’s comparable sales for the first quarter of fiscal year 2016 were down 5 percent versus a 4 percent decrease last year. Comparable sales by global brand for the first quarter were as follows:

    •   Gap Global: negative 3 percent versus negative 10 percent last year
    • Banana Republic Global: negative 11 percent versus negative 8 percent last year
    • Old Navy Global: negative 6 percent versus positive 3 percent last year

    Net sales for the first quarter of fiscal year 2016 were $3.44 billion compared with $3.66 billion for the first quarter of fiscal year 2015. The translation of foreign currencies into U.S. dollars negatively impacted the company’s reported net sales for the first quarter of fiscal year 2016 by about $20 million. In calculating the net sales change on a constant currency basis, current year foreign exchange rates are applied to both current year and prior year net sales. This is done to enhance the visibility of underlying sales trends, excluding the impact of foreign currency exchange rate fluctuations. So far as the demographic distribution of revenue is concerned , USA still leading the charts with 77.31% share in the total revenue however in the quarter 1 of 2015 , the USA accounted 82% share . Old Navy contributed the highest share in the revenue with  43% while the Gap Global and Banana Republic Global contributed 36% and 16% respectively in the Quarter 1 ,2016

    The following table details the company’s first quarter fiscal year 2016 net sales:

    US$(In Millions)

    Regions

    Gap Global

    Old Navy Global

    Banana Republic Global

    Other

    Total

    % of Net Sales

    U.S.A

    698

    1,328

    454

    178

    2658

    77.31%

    Canada

    70

    98

    47

    1

    216

    6.28%

    Europe

    144

    0

    14

    0

    158

    4.60%

    Asia

    280

    50

    26

    0

    356

    10.35%

    Other regions

    31

    10

    9

    0

    50

    1.45%

    Total

    1223

    1486

    550

    179

    3438

    100.00%

     
    GAP Q1 2016 | Denimsandjeans.com
     
    GAP Q1 2016 | Denimsandjeans.com
     
    The demographical distribution of revenue doesn’t seem to be very encouraging for the Q1 2016 as most of the region contributed less revenue as compared to the Q1 2015. The leader in the chart , USA contributed US$ 2658 million in this quarter while in the same quarter in the previous year , the contribution was US$ 2828 million. Not only USA , the other regions like Canada and Europe have been following the same trend.  However the fall in the revenue of Asian region is the lowest.
     

    US$ (In Millions)

    Regions

    Q1 (2015)

    Q1(2016)

    U.S.A

    2828

    2658

    Canada

    224

    216

    Europe

    181

    158

    Asia

    355

    356

    Other regions

    69

    50

    Total

    3657

    3438

    GAP Q1 2016 | Denimsandjeans.com

    The most distressing figure is its net income ,which fell down to US$ 127 Million from US$ 239 and it is due to rise in the operating as well as as the non operating expenses. The company needs to seriously look in to its cost management as well as in its distribution in order to present a healthy financials. Gap Inc.’s first quarter fiscal year 2016 diluted earnings per share were US$0.32 against US$0.56 in 2015.

    US$ (In Millions)

    Particulars

    Gross Profit

    Net Income

    Q1 2015

    1,382

    239

    Q1 2016

    1,209

    127

    Restructuring

    In an effort to control its costs and improve profitability,the  clothing retailer  will close its fleet of 53 Old Navy stores in Japan. All in all it will be closing 75 stores in an effort to save $275 million annually. As part of this restructuring, Old Navy will close stores in Japan and focus on growth in North America and China. The brand saw a 6 percent global same-store sales decline in the quarter. Gap emphasized that Japan remains an important market for the company’s portfolio and that 200 Gap and Banana Republic stores will remain in the country.

    Many of Gap’s problems are those facing other retailers as well, analysts said. Shoppers are reluctant to spend on clothing, and many aren’t rushing to the mall — this time of year is particularly slow for retailers.  Macy’s, Kohl’s and Nordstrom all reported disappointing first-quarter results. Also Gap never evolved beyond its reputation as a place for clean-cut basics. While other retailers such as J. Crew   and Urban Outfitters updated their aesthetic to keep up with changing times, Gap never successfully managed to modernize.  And this is justified by the fact that Gap shares are down more than 50 per cent since the beginning of 2015.

    GAP Q1 2016 | Denimsandjeans.com

  • US Imports 2016 | Men’s Jeans Fall While Women Jeans Rise!

    US Imports 2016 | Men’s Jeans Fall While Women Jeans Rise!

    The denim market scenario is US does not look too rosy with the latest statistics coming out. The market saw a down trend with the Men’s jeans imports taking a knock in the first quarter of 2016 . Going down 4.4% in absolute quantities, the men’s denim apparel carried forward the trend of the last few years of slump in demand. Lets see below the data of Men’s Denim and Women’s denim apparel imports into the US in the first quarter of 2016.

    Men’s Denim Imports (2015-2016, 1st quarter)
    Year Men’s Denim Apparel % change
    2015 (Jan-March) 46.92 million pcs
    2016 (Jan-March) 44.88 million pcs -4.4%

    The first quarter of the year is normally the slowest of the four quarters.  Though not too much can be predicted for the whole year but the starting of the year does not inspire.

    Women’s denim however, does inspire a bit as it  does not go negative and keeps its head over water with a marginal 0.4% growth.

    Women’s Denim Imports (2015-2016 , 1st quarter)
    Year Women’s Denim Apparel % change
    2015 (Jan-March) 41.19 million pcs
    2016 (Jan-March) 41.55 million pcs +0.4%

    The second quarter would be critical as it would define the movement of the denim demand and the resultant imports from around the world – which constitutes more than 95% of total denim consumed in US.

    The denim apparel imports into US peaked in 2013 at about 522 million pcs but slowly declined and fell to 475 million pcs in 2015. It remains to be seen how this year will perform. The initial data is not encouraging !

  • US Denim Imports | Bangladesh And China | 2009-2015

    US Denim Imports | Bangladesh And China | 2009-2015

    U.S. imports from Asia, the largest regional supplier — accounting for three-quarters of all sector imports. Amongh the countries China and Bangladesh are two important countries which are major exporters of denim apparel to US.  In this report, we have explained the trends in imports into USA during 2009 to 2015 these two countries .  The report consists of following tables and graphs to bring out the details of the business from these countries.

    Serial No Particulars
    1 Table  Showing Imports of all Denim Apparels(Million Pcs) and Average Price  into USA from China for the years 2009-2015
    2 Graph showing Imports of all Denim Apparels into USA from China for  the years  2009-2015
    3 Graph showing Average Price  of Imports of all Denim Apparels into USA from China for the years 2009-2015
    4 Table  Showing Imports of Men’s Jeans  and Average Price  into USA from China for the years 2009-2015
    5 Graph showing Imports of Men’s Jeans into USA from China for the years 2009-2015
    6 Graph showing Average Price  of Imports of Men’s Jeans  into USA from China for the years 2009-2015
    7 Table  Showing Imports of Women’s Jeans  and Average Price  into USA from China for the years 2009-2015
    8 Graph showing Imports of Women’s Jeans into USA from China for the years 2009-2015
    9 Graph showing Average Price of Imports of Women’s Jeans into USA from China for the years 2009-2015
    10 Table  Showing Imports of all Denim Apparels  and Average Price into USA from Bangladesh for the years 2009-2015
    11 Graph showing Imports of all Denim Apparels into USA from Bangladesh for the years 2009-2015
    12 Graph showing Average Price of Imports of all Denim Apparels into USA from Bangladesh for the years 2009-2015
    13 Table  Showing Imports of Men’s Jeans  and Average Price  into USA from Bangladesh for the years 2009-2015
    14 Graph showing Imports of Men’s Jeans into USA from Bangladesh for the years 2009-2015
    15 Graph showing Average Price of Imports of Men’s Jeans into USA from Bangladesh for the years 2009-2015
    16 Table  Showing Imports of Women’s Jeans  and Average Price  into USA from Bangladesh for the years 2009-2015
    17 Graph showing Imports of Women’s Jeans into USA from Bangladesh for the years 2009-2015
    18 Graph showing Average Price of Imports of Women’s Jeans into USA from Bangladesh for the years 2009-2015
    19 Table showing share of China and Bangladesh into the total import of all denim apparels of USA for the years 2009-2015
    20 Graph showing share of China and Bangladesh into the total import of all denim apparels of USA for the years 2009-2015

    [wlm_private_special]

    Imports From China

    Till the year 2010 , everything was perfect – imports of denim apparel from China were increasing at a good pace and was almost at their  highest  . However, from 2010 the scenario started worsening  with every passing year. With a growth in the import by 14.28% in 2010 , no one had predicted that the imports from China to USA will be fallen by 28.08% by the end of the year 2011. In 2012 the conditions seemed to be bit improved but again in 2014 as well as in 2015 the imports fell down . In 2013 the total imports were 155.23 million pcs which reduced to 133.13 millions pcs by the end of 2015 . The average price of imports (US$/Pcs) also changed , however the degree of change was bit lesser against the substantial decline of imports over the years. In 2009 the Average Price was US$7.49/Pc which reached to its all time high in 2013 at US$8.43/Pc.  From 2012 , it started reducing but in 2015 it again rose by 2.13% and reached to US$7.52/Pc

    Year

    2009

    2010

    2011

    2012

    2013

    2014

    2015

    Million Pcs

    160.01

    186.66

    145.74

    147.29

    155.23

    135.37

    133.13

    Imports of all Denim Apparels(Million Pcs) and Average Price (US$/Pcs) into USA from China from the year 2009-2015

    Year

    2009

    2010

    2011

    2012

    2013

    2014

    2015

    US$/pc

    7.49

    7.29

    8.43

    7.99

    7.93

    7.36

    7.52

     Average Price(US$/Pcs) of Imports of all Denim Apparels(Million Pcs)into USA from China from the year 2009-2015

    Segregating the total imports into two parts ; Men’s Jeans and Women’s Jeans , the share of Men’s Jeans seems to be lesser as compared to Women’s Jeans. The Import of Men’s Jeans was only 44.27 Million Pcs while the import of Women’s jeans was whopping 115.74 million pcs for the same year. Imports of both Men and Women Jeans declined but the import of Men jeans fell  by whopping by 53.52% in 2011 while the import of women jeans fell by 20.84% in 2011. Year 2014 and 2015 were also not so encouraging for China and from 49.54 million pcs in 2010 , the import reduced to 31.13 million pcs of Men’s Jeans in 2015. The trend to fall also observed in the women’s jeans and the major fall was in 2014 when the imports fell by  13.26 % after registering a growth of 5.36% in 2013.

    The average price of Men’s jeans increased from US$7.91/pcs in 2009 to US$9.43/pcs in 2012 while the average price of Women’s jeans were increased from US$7.32/pcs in 2009  to US$8.15/pcs in 2015

    Men’s Jeans Imports (million pcs)

    Year

    2009

    2010

    2011

    2012

    2013

    2014

    2015

    Million Pcs

    44.27

    49.54

    32.27

    35.28

    36.88

    30.84

    31.13

     Import of Men's Jeans into USA from China| 2009 -2015

    Year

    2009

    2010

    2011

    2012

    2013

    2014

    2015

    US$/PC

    7.91

    7.81

    9.43

    8.39

    7.77

    7.67

    7.97

    Average Price of Import of Men's Jeans into USA from China| 2009 -2015

    Year

    2009

    2010

    2011

    2012

    2013

    2014

    2015

    Million Pcs

    115.74

    137.12

    113.47

    112.01

    118.36

    104.53

    102

    Average Price of Import of Women's Jeans into USA from China| 2009 -2015

    Year

    2009

    2010

    2011

    2012

    2013

    2014

    2015

    Average Price

    7.32

    7.1

    8.15

    7.86

    7.97

    7.27

    7.38

    Average Price of Import of Women's Jeans into USA from Bangladesh | 2009 -2015

    Bangladesh

    The second major exporting country is Bangladesh which is now one of the major denim manufacturing country and the closest competitor of China. From the declining trends after the year 2010 , Bangladesh recovered in 2012 by showing a marginal growth in the export from 64.15 million pcs in 2012 to 72.23 million pcs in 2014 , however due to slowdown in the US economy , from 2014 again the imports started reducing and reached to the lowest level of 67.02 million pcs in 2015.

    The average price in the span of 5 years starting from 2010 has changed by more than one dollar . In 2010 the average price was US$5.22/pc which rose to the level of US$6.53/pc in 2015 .

    Year

    2009

    2010

    2011

    2012

    2013

    2014

    2015

    Million Pcs

    68.7

    79.48

    63.59

    64.15

    72.23

    67.58

    67.02

    Imports of All Denim Apparels to USA from Bangladesh | 2009 -2015

    Year

    2009

    2010

    2011

    2012

    2013

    2014

    2015

    Average Price

    5.22

    5.16

    6.41

    6.41

    6.3

    6.4

    6.53

    Average Price of Import of All Denim Apparels Into USA from Bangladesh | 2009 -2015

    Dividing Bangladesh’s exports of denim apparel to USA into two ; Men’s Jeans and Women’s Jeans, it was found that unlike  China , Bangladesh exports Men’s Jeans in larger quantities as against  Women Jeans. In 2009 , Bangladesh exported 45.55 million pcs of men’s jeans and 23.15 million pcs of women’s jeans to USA.  Surprisingly in 2015 there was a  fall in the imports of Men’s Jeans while there was a growth in the exports of  Women’s Jeans. In 2015 , the import of men’s jeans fell by 5.45% however the import of women’s jeans increased by 6.53%.

    The Average price of Men’s jeans in 2009 was US$5.13/pc while the women’s jeans was US$5.41/pc. From 2010 ,the growth in average price for the men’s jeans was merely 14.45% ,however the growth in the average price of women’s jeans was more than twice from 2010 i.e 30.21%

    Men’s Jeans

    Year

    2009

    2010

    2011

    2012

    2013

    2014

    2015

    Million Pcs

    45.55

    52.87

    42.9

    42.02

    46.09

    43.54

    41.29

    Import of Men's Jeans Into USA from Bangladesh | 2009 -2015

    Year

    2009

    2010

    2011

    2012

    2013

    2014

    2015

    Average Price

    5.13

    5.21

    6.57

    6.34

    6.24

    6.2

    6.09

    Average Price of Import of Men's Denim Into USA from Bangladesh

    Year

    2009

    2010

    2011

    2012

    2013

    2014

    2015

    Million Pcs

    23.15

    26.6

    20.69

    22.13

    26.14

    24.05

    25.73

    Import of Women's Jeans Into USA from Bangladesh |


    Year

    2009

    2010

    2011

    2012

    2013

    2014

    2015

    Average Price

    5.41

    5.06

    6.08

    6.54

    6.41

    6.75

    7.25


    Average Price of Imports of Women’s Jeans into USA from Bangladesh from the year 2009-2015

    Analyzing the share of China and Bangladesh in the total imports by USA, it is found that where  Bangladesh managed to increase its share by the end of every year , the share of China seems to be inconsistent and on average it reduced from 31.13% in 2010 to 28.33% in 2015. However the share of Bangladesh increased marginally from 13.26% in 2010 to 14.26% in 2015. Interestingly, the total exports  by Bangladesh reduced from 79.48 million pcs in 2010 to million pcs to 67.02 million pcs in 2015. This was in line with the general reduction in the overall volume of imports of denim apparel into US. However, this is not the case for all countries. Some countries like Vietnam have shown remarkable improvements in exports of apparel to US during the same period.

    Year of

    World

    Bangladesh


    China


    Import

    (million pcs)

    (million pcs)

    % Share

    (million pcs)

    % Share

    2009

    568.46

    68.7

    12.09%

    160.01

    28.15%

    2010

    599.57

    79.48

    13.26%

    186.66

    31.13%

    2011

    511.31

    63.59

    12.44%

    145.74

    28.50%

    2012

    493.77

    64.15

    12.99%

    147.29

    29.83%

    2013

    515.03

    72.23

    14.02%

    155.23

    30.14%

    2014

    474.06

    67.58

    14.26%

    135.37

    28.56%

    2015

    469.98

    67.02

    14.26%

    133.13

    28.33%


    From the graph below, we can see that the share of China receding and that of Bangladesh comparatively better but not increasing as such.  The market share of US is continuously falling and unless the market improves the exports from any of the countries will not increase either.

    share of China and Bangladesh into the total import of all denim apparels of USA from the year 2009-2015

    [/wlm_private_special]


  • GAP Inc Stock Drops After Company Reports Big Fall In Sales

    GAP Inc Stock Drops After Company Reports Big Fall In Sales

    The San Francisco-based company has been struggling to keep pace with the ,so-called ,fast apparel retailers such as UNIQLO and H&M in recent years. The loss of Old Navy boss Stefan Larsson to head luxury fashion brand Ralph Lauren in September hasn’t helped. Larsson was widely credited with turning around Gap’s budget retail brand.

    Old Navy sales dropped 8 percent in the three months ending in January, down from 11 percent growth in the same quarter of the previous year, the company said . Banana Republic revenue dropped 14 percent compared with 1 percent year-over-year growth. Gap brand sales narrowed losses, to negative 3 percent from negative 6 percent, indicating some stabilization in the company’s namesake brand. Net sales in January were $813 million, down from $888 million in the same month last year.

    GAP Inc | Denimsandjeans.com

    The overall revenue of the company is almost stable with a slight increase though in 2015 increasing to $16.43 billion. However, this reflects poorly when compared with growth in companies like Uniqlo and H&M.

    GAP Inc | Denimsandjeans.com

    Net income fell from $1.28 billion to $1.24 billion showing the pressure the company is facing in its margins.

    GAP Inc | Denimsandjeans.com

    However, 2016 is more disturbing for the company and sales expected to go down further this year. As far as the January Comparable Sales Results is concerned ,Gap Inc.’s comparable sales for January 2016 were down 8 percent versus negative 3 percent last year. Comparable sales by global brand for January 2016 were as follows:

    • Gap Global: negative 6 percent versus negative 9 percent last year
    • Banana Republic Global: negative 17 percent versus positive 2 percent last year
    • Old Navy Global: negative 6 percent versus positive 3 percent last year

    GAP Inc | Denimsandjeans.com

    Looking at the Gap Inc.’s comparable sales for the fourth quarter of fiscal year 2015 , we find that these show the same trend as we see in Jan’2016. Sales were down 7 percent versus positive 2 percent last year. Comparable sales by global brand for the fourth quarter were as follows:
    • Gap Global: negative 3 percent versus negative 6 percent last year
    • Banana Republic Global: negative 14 percent versus positive 1 percent last year
    • Old Navy Global: negative 8 percent versus positive 11 percent last year

    GAP Inc | Denimsandjeans.com

    Gap Inc. shares reported lower year-over-year sales and its share price reached to the lowest level at $25.45 . Grim quarterly sales numbers suggest the problems facing the company’s Gap and Banana Republic outlets might be spreading to Old Navy, which had performed well through most of last year.

    GAP Inc | Denimsandjeans.com

    It seems that GAP needs to urgently revamp its sales strategies in view of competition from Fast-Retailers and changing consumer tastes. The consumers are losing their appetite for long established brands in favor of quick fashion and high quality clothing and all the established retailers need to take that into consideration.

    About GAP Inc.

    The Gap, Inc., commonly known as Gap Inc. or Gap, is an American multinational clothing and accessories retailer.It was founded in 1969 by Donald Fisher and Doris F. Fisher and is headquartered in San Francisco, California. The company operates five primary divisions: the namesake banner, Banana Republic, Old Navy, Intermix, and Athleta. Gap Inc. is behind Inditex Group and H&M in the total numbers of international locations. However, it remains the largest specialty retailer in the United States. As of September 2008, the company has approximately 135,000 employees and operates 3,076 stores worldwide, of which 2,551 are located in the U.S

  • Gap Looses US Market Share

    Gap Looses US Market Share

    US retail market is highly competitive and a large number of Speciality stores, Brand Stores, Discount stores, Departmental Stores compete with each other – continuously striving to get the attention of the American customer who is not increasing his spending but is reallocating his funds between different brands and retailers. This reallocation of money by buyers is benefitting some retailers while others are losing . Gap , unfortunately, is finding its place among the latter. The most sought after casual brand in US may not remain so in the coming years as  Gap’s share of US apparel market fell from 5.1% to 4.7% over the past five years with a recovery not in sight. Let’s see how Gap stacks in comparison to other apparel retailers in US.

    1. Multi brand retail chain Macy’s : 9% approx.
    2. General Merchandise retailers

    • Wal Mart – 7% approx.
    • Target – 5.4%
    • Gap – 4.7%
    • JC Penny – 3.3%
    • American Eagle, Aeropostale and A&F – 2% each approx.

    The remaining 65% share is held by a number of private label brands , pure online players, fast fashion players , department stores etc. Here is a break up of the market share as per Forbes.

    U.S.-Apparel-Market-Share

    Source : Forbes.com
    gap-inc-market-share-trend

    Source: Forbes.com

    Whereas Gap’s market share has reduced from 1.71% is 2009 to 1.41% is 2014, that of Old Navy and Banana Republic has also fallen. The reason for growth of share from 4.34% in 2012 to 4.71% in 2014 has been the growth driver brands Athleta and the acquisition of Intermix.

    One of the major reasons for Gap losing its market share has been the growth of fast fashion retailers  like the Inditex , H&M and to some extent Forever 21. There has been a constant movement of buyers from casual clothing to affordable fast fashion. Today’s teenagers are getting less attached to brands and are more concerned over having a fresh look every few days. Technology is pushing this trend. With the proliferation of  ‘Whatsapp’, ‘Viber’,’Facebook’ and the likes , the SELFIE culture is becoming a dominant youth phenomenon constantly pushing these young ones to look better and share . This trend is helping fast fashion retailers like Inditex and hurting the long established ones like GAP. This has become one major factor affecting GAP’s performance .And related to this has been the other reason of underperformance – poor performance of GAP’s women’s business – while its other business including men, kids and baby are doing reasonably well.

    The result has been clear for GAP. It has planned to close 175 of its speciality GAP Inc stores –with 140 going down this year and balance in the year next. After these closures it will have about 800 stores in US. It is expected to lose about $300 million from these closures- an amount which is expected to be covered from better performance from other channels including Online.